|
Download Data (XLS File) |
|
||||||||
|
||||||||
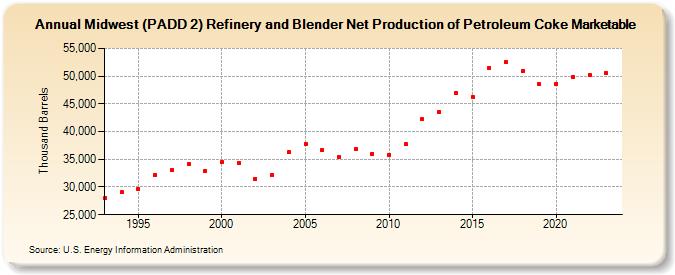
| Midwest (PADD 2) Refinery and Blender Net Production of Petroleum Coke Marketable (Thousand Barrels) | ||||||||
| Decade | Year-0 | Year-1 | Year-2 | Year-3 | Year-4 | Year-5 | Year-6 | Year-7 | Year-8 | Year-9 |
|---|---|---|---|---|---|---|---|---|---|---|
| 1990's | 27,987 | 29,010 | 29,641 | 32,236 | 33,116 | 34,125 | 32,971 | |||
| 2000's | 34,503 | 34,376 | 31,502 | 32,183 | 36,237 | 37,818 | 36,654 | 35,341 | 36,779 | 36,009 |
| 2010's | 35,845 | 37,677 | 42,211 | 43,573 | 46,945 | 46,270 | 51,500 | 52,502 | 50,917 | 48,518 |
| 2020's | 48,637 | 49,914 | 50,192 | 50,571 |
| - = No Data Reported; -- = Not Applicable; NA = Not Available; W = Withheld to avoid disclosure of individual company data. |
| Release Date: 3/29/2024 |
| Next Release Date: 8/30/2024 |