|
Download Data (XLS File) |
|
||||||||
|
||||||||
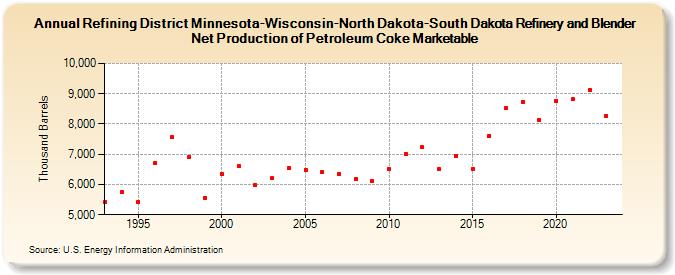
| Refining District Minnesota-Wisconsin-North Dakota-South Dakota Refinery and Blender Net Production of Petroleum Coke Marketable (Thousand Barrels) | ||||||||
| Decade | Year-0 | Year-1 | Year-2 | Year-3 | Year-4 | Year-5 | Year-6 | Year-7 | Year-8 | Year-9 |
|---|---|---|---|---|---|---|---|---|---|---|
| 1990's | 5,427 | 5,741 | 5,427 | 6,717 | 7,559 | 6,897 | 5,564 | |||
| 2000's | 6,354 | 6,603 | 5,985 | 6,213 | 6,543 | 6,492 | 6,409 | 6,334 | 6,182 | 6,099 |
| 2010's | 6,519 | 7,016 | 7,228 | 6,510 | 6,946 | 6,519 | 7,611 | 8,516 | 8,728 | 8,124 |
| 2020's | 8,771 | 8,816 | 9,118 | 8,280 |
| - = No Data Reported; -- = Not Applicable; NA = Not Available; W = Withheld to avoid disclosure of individual company data. |
| Release Date: 3/29/2024 |
| Next Release Date: 8/30/2024 |