|
Download Data (XLS File) |
|
||||||||
|
||||||||
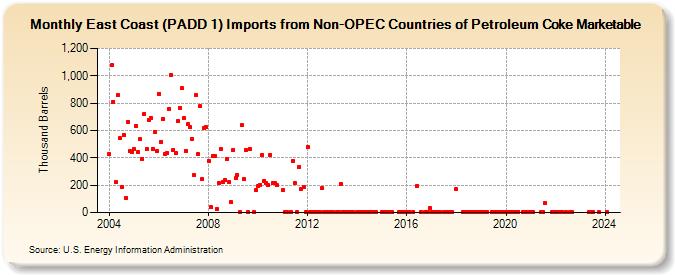
| East Coast (PADD 1) Imports from Non-OPEC Countries of Petroleum Coke Marketable (Thousand Barrels) | ||||||||
| Year | Jan | Feb | Mar | Apr | May | Jun | Jul | Aug | Sep | Oct | Nov | Dec |
|---|---|---|---|---|---|---|---|---|---|---|---|---|
| 2004 | 425 | 1,076 | 811 | 221 | 861 | 542 | 188 | 569 | 109 | 665 | 448 | 443 |
| 2005 | 462 | 636 | 442 | 535 | 395 | 723 | 464 | 677 | 692 | 468 | 592 | 449 |
| 2006 | 869 | 518 | 685 | 427 | 437 | 758 | 1,008 | 460 | 435 | 668 | 764 | 908 |
| 2007 | 691 | 453 | 646 | 623 | 539 | 273 | 857 | 428 | 778 | 245 | 620 | 622 |
| 2008 | 380 | 37 | 414 | 415 | 27 | 217 | 461 | 221 | 237 | 394 | 223 | 74 |
| 2009 | 456 | 249 | 275 | 1 | 637 | 244 | 456 | 2 | 464 | 1 | 162 | |
| 2010 | 196 | 203 | 420 | 233 | 215 | 198 | 421 | 215 | 218 | 199 | ||
| 2011 | 163 | 1 | 3 | 2 | 376 | 213 | 2 | 336 | 175 | 186 | 1 | |
| 2012 | 478 | 1 | 6 | 1 | 2 | 1 | 1 | 176 | 1 | 1 | 1 | 1 |
| 2013 | 1 | 2 | 1 | 209 | 3 | 4 | 4 | 2 | 2 | 2 | ||
| 2014 | 1 | 1 | 1 | 1 | 2 | 2 | 2 | 2 | 1 | 1 | ||
| 2015 | 1 | 1 | 1 | 1 | 2 | 2 | 2 | 1 | 1 | 1 | ||
| 2016 | 1 | 7 | 1 | 193 | 1 | 1 | 1 | 33 | ||||
| 2017 | 3 | 1 | 3 | 4 | 2 | 3 | 1 | 4 | 3 | 1 | ||
| 2018 | 170 | 1 | 4 | 3 | 3 | 3 | 2 | 3 | 1 | 3 | ||
| 2019 | 6 | 4 | 7 | 3 | 1 | 1 | 1 | 1 | 1 | 1 | 2 | |
| 2020 | 1 | 2 | 1 | 2 | 2 | 3 | 7 | 4 | 7 | 6 | 2 | |
| 2021 | 6 | 1 | 1 | 1 | 69 | 1 | 4 | |||||
| 2022 | 4 | 3 | 1 | 1 | 1 | 1 | 1 | |||||
| 2023 | 1 | 1 | 1 | 1 | ||||||||
| 2024 | 1 | 2 | 2 | 1 | ||||||||
| - = No Data Reported; -- = Not Applicable; NA = Not Available; W = Withheld to avoid disclosure of individual company data. |
| Release Date: 8/30/2024 |
| Next Release Date: 9/30/2024 |