|
Download Data (XLS File) |
|
||||||||
|
||||||||
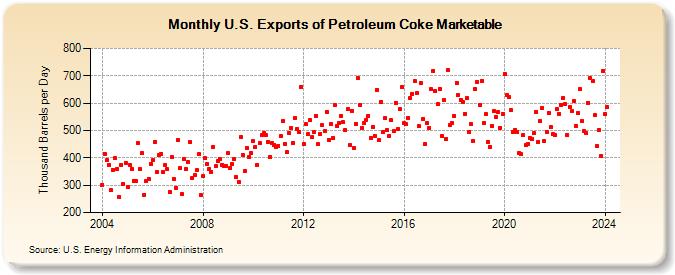
| U.S. Exports of Petroleum Coke Marketable (Thousand Barrels per Day) | ||||||||
| Year | Jan | Feb | Mar | Apr | May | Jun | Jul | Aug | Sep | Oct | Nov | Dec |
|---|---|---|---|---|---|---|---|---|---|---|---|---|
| 2004 | 302 | 415 | 391 | 375 | 281 | 357 | 400 | 360 | 256 | 374 | 305 | 382 |
| 2005 | 293 | 373 | 361 | 315 | 317 | 454 | 359 | 416 | 266 | 316 | 324 | 377 |
| 2006 | 391 | 459 | 350 | 411 | 415 | 347 | 373 | 358 | 276 | 402 | 324 | 291 |
| 2007 | 466 | 363 | 268 | 397 | 360 | 385 | 458 | 327 | 337 | 354 | 413 | 265 |
| 2008 | 333 | 399 | 379 | 359 | 350 | 441 | 369 | 388 | 394 | 375 | 371 | 371 |
| 2009 | 416 | 363 | 378 | 395 | 330 | 311 | 476 | 411 | 352 | 436 | 404 | 418 |
| 2010 | 460 | 441 | 373 | 453 | 482 | 490 | 483 | 459 | 403 | 454 | 447 | 440 |
| 2011 | 445 | 479 | 533 | 451 | 420 | 491 | 510 | 454 | 546 | 505 | 495 | 659 |
| 2012 | 449 | 523 | 487 | 537 | 475 | 496 | 552 | 449 | 488 | 519 | 497 | 569 |
| 2013 | 467 | 525 | 473 | 593 | 518 | 528 | 553 | 530 | 502 | 577 | 447 | 573 |
| 2014 | 436 | 523 | 691 | 593 | 510 | 526 | 540 | 554 | 473 | 512 | 481 | 649 |
| 2015 | 464 | 605 | 494 | 547 | 500 | 480 | 537 | 498 | 601 | 506 | 577 | 658 |
| 2016 | 526 | 523 | 547 | 619 | 634 | 679 | 636 | 517 | 674 | 543 | 451 | 527 |
| 2017 | 509 | 650 | 719 | 645 | 596 | 653 | 481 | 613 | 468 | 720 | 519 | 527 |
| 2018 | 553 | 674 | 629 | 613 | 604 | 561 | 617 | 494 | 522 | 461 | 651 | 678 |
| 2019 | 593 | 682 | 529 | 559 | 459 | 441 | 516 | 570 | 550 | 567 | 510 | 562 |
| 2020 | 708 | 628 | 624 | 574 | 496 | 501 | 494 | 417 | 413 | 482 | 446 | 451 |
| 2021 | 472 | 468 | 490 | 569 | 459 | 535 | 583 | 461 | 496 | 565 | 512 | 486 |
| 2022 | 484 | 577 | 561 | 594 | 620 | 596 | 484 | 585 | 570 | 608 | 517 | 564 |
| 2023 | 650 | 534 | 498 | 489 | 602 | 690 | 680 | 556 | 442 | 502 | 406 | 719 |
| 2024 | 560 | |||||||||||
| - = No Data Reported; -- = Not Applicable; NA = Not Available; W = Withheld to avoid disclosure of individual company data. |
| Release Date: 3/29/2024 |
| Next Release Date: 4/30/2024 |