|
Download Data (XLS File) |
|
||||||||
|
||||||||
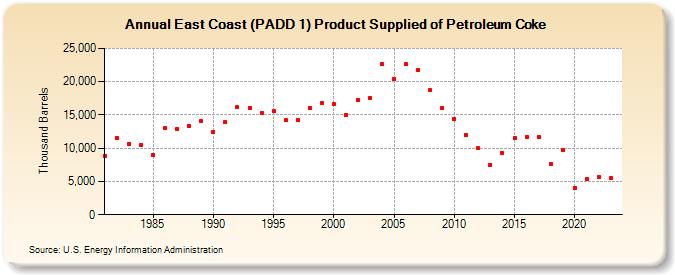
| East Coast (PADD 1) Product Supplied of Petroleum Coke (Thousand Barrels) | ||||||||
| Decade | Year-0 | Year-1 | Year-2 | Year-3 | Year-4 | Year-5 | Year-6 | Year-7 | Year-8 | Year-9 |
|---|---|---|---|---|---|---|---|---|---|---|
| 1980's | 8,849 | 11,509 | 10,595 | 10,514 | 9,020 | 13,017 | 12,922 | 13,368 | 14,042 | |
| 1990's | 12,484 | 13,864 | 16,121 | 16,083 | 15,284 | 15,525 | 14,189 | 14,302 | 16,037 | 16,727 |
| 2000's | 16,616 | 15,035 | 17,258 | 17,520 | 22,583 | 20,367 | 22,607 | 21,817 | 18,672 | 16,057 |
| 2010's | 14,418 | 12,013 | 9,967 | 7,537 | 9,222 | 11,584 | 11,754 | 11,654 | 7,587 | 9,684 |
| 2020's | 4,081 | 5,297 | 5,693 | 5,793 |
| - = No Data Reported; -- = Not Applicable; NA = Not Available; W = Withheld to avoid disclosure of individual company data. |
| Release Date: 8/30/2024 |
| Next Release Date: 8/29/2025 |