|
Download Data (XLS File) |
|
||||||||
|
||||||||
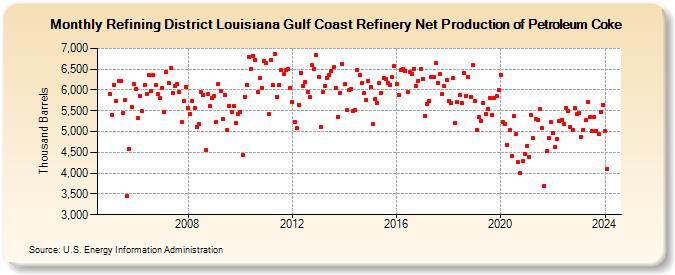
| Refining District Louisiana Gulf Coast Refinery Net Production of Petroleum Coke (Thousand Barrels) | ||||||||
| Year | Jan | Feb | Mar | Apr | May | Jun | Jul | Aug | Sep | Oct | Nov | Dec |
|---|---|---|---|---|---|---|---|---|---|---|---|---|
| 2005 | 5,906 | 5,405 | 6,130 | 5,731 | 6,219 | 6,223 | 5,439 | 5,749 | 3,447 | 4,592 | 5,592 | 6,139 |
| 2006 | 6,014 | 5,319 | 5,852 | 5,487 | 6,124 | 5,912 | 6,351 | 5,976 | 6,349 | 6,109 | 5,900 | 5,806 |
| 2007 | 6,056 | 5,472 | 6,442 | 6,163 | 6,537 | 5,920 | 6,097 | 6,148 | 5,950 | 5,228 | 5,728 | 6,070 |
| 2008 | 5,562 | 5,421 | 5,737 | 5,571 | 5,116 | 5,173 | 5,961 | 5,884 | 4,546 | 5,896 | 5,609 | 5,801 |
| 2009 | 5,853 | 5,233 | 6,143 | 5,987 | 5,309 | 5,872 | 5,026 | 5,622 | 5,482 | 5,615 | 5,209 | 5,426 |
| 2010 | 5,466 | 4,440 | 5,836 | 6,111 | 6,793 | 6,502 | 6,825 | 6,732 | 5,948 | 6,282 | 6,057 | 6,690 |
| 2011 | 6,654 | 5,427 | 6,724 | 6,119 | 6,854 | 5,833 | 6,114 | 6,480 | 6,383 | 6,470 | 6,493 | 6,055 |
| 2012 | 5,719 | 5,230 | 5,084 | 5,631 | 6,419 | 6,090 | 6,197 | 5,946 | 5,830 | 6,605 | 6,507 | 6,843 |
| 2013 | 6,302 | 5,120 | 5,940 | 6,100 | 6,281 | 6,372 | 6,464 | 6,550 | 6,042 | 5,355 | 5,930 | 6,628 |
| 2014 | 6,138 | 5,510 | 5,990 | 6,022 | 5,504 | 5,514 | 6,487 | 6,358 | 6,179 | 5,920 | 5,769 | 6,219 |
| 2015 | 6,081 | 5,180 | 5,774 | 5,675 | 6,160 | 5,939 | 6,293 | 6,275 | 6,173 | 6,130 | 6,306 | 6,566 |
| 2016 | 6,132 | 5,870 | 6,489 | 6,509 | 6,452 | 5,948 | 6,437 | 6,383 | 6,505 | 6,093 | 6,219 | 6,512 |
| 2017 | 6,272 | 5,365 | 5,673 | 5,736 | 6,309 | 6,303 | 6,640 | 6,179 | 6,390 | 5,901 | 6,095 | 6,242 |
| 2018 | 5,731 | 5,676 | 6,283 | 5,209 | 5,716 | 5,872 | 5,690 | 6,411 | 5,861 | 6,318 | 5,841 | 6,589 |
| 2019 | 5,733 | 5,033 | 5,339 | 5,248 | 5,681 | 5,434 | 5,546 | 5,815 | 5,405 | 5,817 | 5,846 | 5,992 |
| 2020 | 6,349 | 5,239 | 5,186 | 4,668 | 5,039 | 4,417 | 5,379 | 4,935 | 4,258 | 3,993 | 4,285 | 4,459 |
| 2021 | 4,664 | 4,382 | 5,402 | 4,838 | 5,299 | 5,270 | 5,551 | 5,082 | 3,698 | 4,530 | 4,843 | 5,240 |
| 2022 | 4,963 | 4,630 | 4,832 | 5,257 | 5,279 | 5,181 | 5,572 | 5,485 | 5,117 | 5,039 | 5,569 | 5,418 |
| 2023 | 5,443 | 4,866 | 5,048 | 5,271 | 5,711 | 5,351 | 5,009 | 5,352 | 5,015 | 4,940 | 5,464 | 5,643 |
| 2024 | 5,006 | |||||||||||
| - = No Data Reported; -- = Not Applicable; NA = Not Available; W = Withheld to avoid disclosure of individual company data. |
| Release Date: 3/29/2024 |
| Next Release Date: 4/30/2024 |