|
Download Data (XLS File) |
|
||||||||
|
||||||||
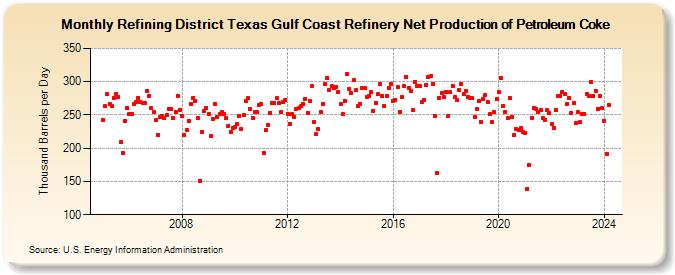
| Refining District Texas Gulf Coast Refinery Net Production of Petroleum Coke (Thousand Barrels per Day) | ||||||||
| Year | Jan | Feb | Mar | Apr | May | Jun | Jul | Aug | Sep | Oct | Nov | Dec |
|---|---|---|---|---|---|---|---|---|---|---|---|---|
| 2005 | 243 | 263 | 281 | 267 | 263 | 276 | 282 | 277 | 209 | 193 | 241 | 260 |
| 2006 | 252 | 251 | 267 | 269 | 276 | 270 | 268 | 268 | 286 | 279 | 260 | 254 |
| 2007 | 242 | 220 | 247 | 248 | 246 | 250 | 259 | 259 | 246 | 254 | 279 | 258 |
| 2008 | 248 | 220 | 228 | 241 | 267 | 276 | 271 | 245 | 151 | 225 | 256 | 261 |
| 2009 | 252 | 219 | 244 | 267 | 247 | 251 | 254 | 251 | 245 | 234 | 225 | 231 |
| 2010 | 232 | 237 | 248 | 229 | 250 | 271 | 275 | 259 | 246 | 255 | 254 | 265 |
| 2011 | 266 | 193 | 227 | 235 | 253 | 268 | 268 | 275 | 268 | 255 | 269 | 273 |
| 2012 | 252 | 237 | 251 | 247 | 259 | 260 | 263 | 267 | 274 | 253 | 271 | 294 |
| 2013 | 239 | 221 | 229 | 255 | 267 | 296 | 306 | 288 | 293 | 291 | 292 | 284 |
| 2014 | 267 | 251 | 271 | 311 | 289 | 283 | 302 | 287 | 263 | 267 | 291 | 290 |
| 2015 | 277 | 279 | 284 | 256 | 268 | 281 | 296 | 278 | 264 | 279 | 290 | 297 |
| 2016 | 271 | 273 | 292 | 255 | 277 | 293 | 307 | 291 | 286 | 257 | 300 | 293 |
| 2017 | 293 | 269 | 273 | 295 | 307 | 308 | 297 | 248 | 163 | 276 | 283 | 277 |
| 2018 | 284 | 249 | 284 | 294 | 277 | 272 | 287 | 296 | 281 | 286 | 277 | 276 |
| 2019 | 275 | 247 | 259 | 271 | 240 | 274 | 280 | 269 | 251 | 240 | 254 | 274 |
| 2020 | 284 | 305 | 264 | 254 | 245 | 276 | 247 | 220 | 229 | 227 | 231 | 224 |
| 2021 | 223 | 139 | 174 | 246 | 260 | 259 | 255 | 257 | 246 | 243 | 258 | 253 |
| 2022 | 236 | 230 | 258 | 279 | 279 | 285 | 281 | 267 | 276 | 253 | 268 | 238 |
| 2023 | 254 | 248 | 251 | 252 | 282 | 278 | 297 | 279 | 289 | 259 | 281 | 263 |
| 2024 | 241 | 192 | 265 | 278 | 265 | 272 | ||||||
| - = No Data Reported; -- = Not Applicable; NA = Not Available; W = Withheld to avoid disclosure of individual company data. |
| Release Date: 8/30/2024 |
| Next Release Date: 9/30/2024 |