|
Download Data (XLS File) |
|
||||||||
|
||||||||
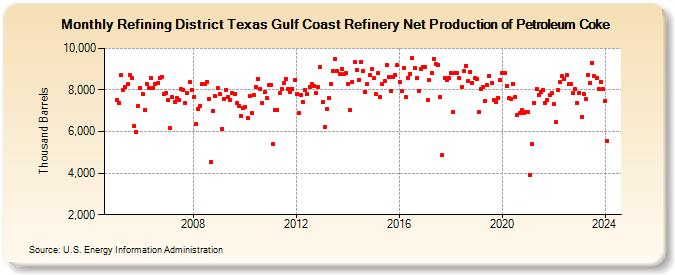
| Refining District Texas Gulf Coast Refinery Net Production of Petroleum Coke (Thousand Barrels) | ||||||||
| Year | Jan | Feb | Mar | Apr | May | Jun | Jul | Aug | Sep | Oct | Nov | Dec |
|---|---|---|---|---|---|---|---|---|---|---|---|---|
| 2005 | 7,530 | 7,358 | 8,720 | 8,016 | 8,138 | 8,271 | 8,736 | 8,576 | 6,257 | 5,982 | 7,239 | 8,073 |
| 2006 | 7,809 | 7,040 | 8,292 | 8,078 | 8,565 | 8,087 | 8,294 | 8,312 | 8,570 | 8,639 | 7,814 | 7,872 |
| 2007 | 7,498 | 6,162 | 7,652 | 7,425 | 7,625 | 7,501 | 8,044 | 8,015 | 7,392 | 7,861 | 8,371 | 7,990 |
| 2008 | 7,675 | 6,378 | 7,077 | 7,239 | 8,279 | 8,273 | 8,396 | 7,584 | 4,520 | 6,990 | 7,687 | 8,091 |
| 2009 | 7,807 | 6,138 | 7,563 | 8,015 | 7,660 | 7,518 | 7,868 | 7,784 | 7,355 | 7,252 | 6,753 | 7,150 |
| 2010 | 7,199 | 6,640 | 7,702 | 6,880 | 7,761 | 8,132 | 8,519 | 8,034 | 7,389 | 7,902 | 7,621 | 8,228 |
| 2011 | 8,234 | 5,390 | 7,031 | 7,053 | 7,838 | 8,052 | 8,320 | 8,539 | 8,050 | 7,892 | 8,059 | 8,463 |
| 2012 | 7,812 | 6,877 | 7,780 | 7,420 | 8,020 | 7,798 | 8,140 | 8,288 | 8,212 | 7,854 | 8,128 | 9,106 |
| 2013 | 7,400 | 6,195 | 7,084 | 7,636 | 8,287 | 8,893 | 9,486 | 8,933 | 8,781 | 9,027 | 8,751 | 8,811 |
| 2014 | 8,287 | 7,039 | 8,407 | 9,325 | 8,958 | 8,487 | 9,354 | 8,891 | 7,899 | 8,287 | 8,717 | 8,992 |
| 2015 | 8,574 | 7,801 | 8,796 | 7,677 | 8,294 | 8,424 | 9,181 | 8,624 | 7,932 | 8,638 | 8,706 | 9,213 |
| 2016 | 8,403 | 7,927 | 9,052 | 7,638 | 8,583 | 8,789 | 9,532 | 9,036 | 8,581 | 7,967 | 8,997 | 9,085 |
| 2017 | 9,098 | 7,539 | 8,474 | 8,839 | 9,505 | 9,251 | 9,214 | 7,676 | 4,891 | 8,565 | 8,492 | 8,577 |
| 2018 | 8,801 | 6,963 | 8,799 | 8,816 | 8,573 | 8,147 | 8,903 | 9,174 | 8,435 | 8,872 | 8,320 | 8,571 |
| 2019 | 8,523 | 6,920 | 8,044 | 8,131 | 7,453 | 8,222 | 8,684 | 8,340 | 7,523 | 7,441 | 7,625 | 8,479 |
| 2020 | 8,819 | 8,831 | 8,195 | 7,605 | 7,581 | 8,277 | 7,648 | 6,810 | 6,883 | 7,036 | 6,915 | 6,937 |
| 2021 | 6,919 | 3,904 | 5,388 | 7,368 | 8,047 | 7,758 | 7,915 | 7,982 | 7,377 | 7,523 | 7,743 | 7,858 |
| 2022 | 7,320 | 6,445 | 7,983 | 8,373 | 8,649 | 8,548 | 8,716 | 8,276 | 8,287 | 7,842 | 8,039 | 7,385 |
| 2023 | 7,872 | 6,935 | 7,783 | 7,549 | 8,742 | 8,348 | 9,207 | 8,661 | 8,657 | 8,044 | 8,419 | 8,152 |
| 2024 | 7,464 | 5,567 | 8,205 | 8,335 | 8,202 | 8,168 | ||||||
| - = No Data Reported; -- = Not Applicable; NA = Not Available; W = Withheld to avoid disclosure of individual company data. |
| Release Date: 8/30/2024 |
| Next Release Date: 9/30/2024 |