|
Download Data (XLS File) |
|
||||||||
|
||||||||
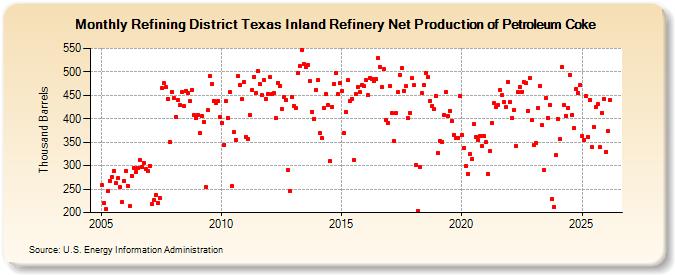
| Refining District Texas Inland Refinery Net Production of Petroleum Coke (Thousand Barrels) | ||||||||
| Year | Jan | Feb | Mar | Apr | May | Jun | Jul | Aug | Sep | Oct | Nov | Dec |
|---|---|---|---|---|---|---|---|---|---|---|---|---|
| 2005 | 258 | 221 | 207 | 247 | 268 | 276 | 289 | 264 | 273 | 255 | 222 | 268 |
| 2006 | 289 | 257 | 213 | 279 | 294 | 287 | 296 | 312 | 297 | 306 | 292 | 289 |
| 2007 | 300 | 218 | 227 | 238 | 221 | 231 | 465 | 476 | 467 | 442 | 351 | 458 |
| 2008 | 444 | 404 | 440 | 430 | 457 | 427 | 460 | 455 | 437 | 462 | 407 | 401 |
| 2009 | 409 | 369 | 405 | 394 | 255 | 418 | 491 | 475 | 438 | 433 | 437 | 403 |
| 2010 | 392 | 345 | 437 | 402 | 456 | 256 | 371 | 355 | 491 | 473 | 442 | 479 |
| 2011 | 362 | 357 | 409 | 461 | 490 | 454 | 501 | 474 | 450 | 483 | 443 | 453 |
| 2012 | 489 | 453 | 455 | 401 | 477 | 470 | 421 | 446 | 441 | 291 | 246 | 447 |
| 2013 | 428 | 422 | 497 | 512 | 547 | 517 | 511 | 515 | 480 | 415 | 400 | 462 |
| 2014 | 483 | 369 | 358 | 422 | 453 | 429 | 309 | 425 | 475 | 497 | 452 | 476 |
| 2015 | 460 | 370 | 415 | 482 | 438 | 443 | 313 | 452 | 468 | 456 | 472 | 470 |
| 2016 | 483 | 450 | 487 | 485 | 480 | 484 | 530 | 510 | 468 | 505 | 397 | 392 |
| 2017 | 470 | 412 | 353 | 412 | 456 | 494 | 508 | 460 | 469 | 401 | 413 | 486 |
| 2018 | 471 | 301 | 204 | 297 | 454 | 472 | 498 | 489 | 438 | 427 | 420 | 449 |
| 2019 | 327 | 353 | 351 | 408 | 457 | 406 | 417 | 396 | 366 | 358 | 359 | 449 |
| 2020 | 365 | 338 | 299 | 283 | 325 | 314 | 388 | 361 | 355 | 363 | 342 | 363 |
| 2021 | 350 | 283 | 331 | 391 | 433 | 424 | 429 | 462 | 450 | 436 | 425 | 479 |
| 2022 | 436 | 402 | 419 | 342 | 456 | 468 | 458 | 478 | 476 | 417 | 487 | 397 |
| 2023 | 345 | 348 | 423 | 470 | 386 | 291 | 444 | 402 | 430 | 228 | 212 | 322 |
| 2024 | 399 | |||||||||||
| - = No Data Reported; -- = Not Applicable; NA = Not Available; W = Withheld to avoid disclosure of individual company data. |
| Release Date: 3/29/2024 |
| Next Release Date: 4/30/2024 |