|
Download Data (XLS File) |
|
||||||||
|
||||||||
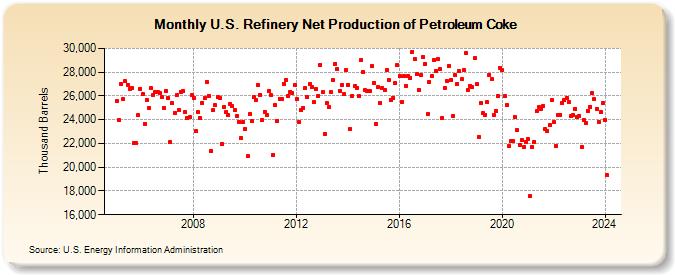
| U.S. Refinery Net Production of Petroleum Coke (Thousand Barrels) | ||||||||
| Year | Jan | Feb | Mar | Apr | May | Jun | Jul | Aug | Sep | Oct | Nov | Dec |
|---|---|---|---|---|---|---|---|---|---|---|---|---|
| 2005 | 25,539 | 23,953 | 26,996 | 25,732 | 27,221 | 26,936 | 26,615 | 26,693 | 22,019 | 22,039 | 24,372 | 26,615 |
| 2006 | 26,124 | 23,655 | 25,668 | 24,987 | 26,635 | 26,074 | 26,317 | 26,337 | 26,284 | 25,920 | 24,993 | 26,437 |
| 2007 | 25,824 | 22,118 | 25,373 | 24,592 | 26,075 | 24,841 | 26,345 | 26,376 | 24,613 | 24,143 | 24,220 | 26,050 |
| 2008 | 25,861 | 23,014 | 24,616 | 24,100 | 25,442 | 25,811 | 27,191 | 25,993 | 21,350 | 24,809 | 25,196 | 25,870 |
| 2009 | 25,834 | 21,991 | 25,071 | 24,685 | 24,359 | 25,339 | 25,143 | 24,808 | 24,311 | 23,823 | 22,440 | 23,811 |
| 2010 | 23,217 | 20,913 | 24,437 | 23,858 | 25,874 | 25,618 | 26,902 | 26,089 | 23,986 | 24,678 | 24,374 | 26,437 |
| 2011 | 26,042 | 21,049 | 25,253 | 23,900 | 25,757 | 25,771 | 27,041 | 27,363 | 25,962 | 26,366 | 26,271 | 26,893 |
| 2012 | 25,759 | 23,793 | 24,847 | 25,005 | 26,685 | 25,869 | 26,991 | 26,715 | 25,450 | 26,573 | 26,031 | 28,628 |
| 2013 | 26,296 | 22,802 | 25,410 | 25,025 | 26,299 | 27,323 | 28,728 | 28,253 | 26,450 | 26,900 | 26,155 | 28,178 |
| 2014 | 26,952 | 23,222 | 26,018 | 26,827 | 26,662 | 25,986 | 28,994 | 27,980 | 26,463 | 26,392 | 26,383 | 28,485 |
| 2015 | 27,121 | 23,656 | 26,745 | 25,434 | 26,675 | 26,519 | 28,148 | 27,341 | 25,681 | 25,858 | 27,078 | 28,578 |
| 2016 | 27,670 | 25,497 | 27,666 | 26,872 | 27,665 | 27,514 | 29,737 | 29,147 | 27,808 | 26,531 | 27,739 | 29,278 |
| 2017 | 28,710 | 24,437 | 27,196 | 27,676 | 29,039 | 28,125 | 29,124 | 28,243 | 24,147 | 26,682 | 27,259 | 28,532 |
| 2018 | 27,358 | 24,315 | 27,740 | 27,003 | 28,073 | 27,395 | 28,199 | 29,609 | 26,529 | 26,862 | 26,718 | 29,164 |
| 2019 | 26,978 | 22,575 | 25,408 | 24,553 | 24,422 | 25,461 | 27,792 | 27,383 | 24,427 | 24,717 | 25,960 | 28,368 |
| 2020 | 28,158 | 25,964 | 25,247 | 21,756 | 22,173 | 22,178 | 24,200 | 23,091 | 21,900 | 22,324 | 21,675 | 22,150 |
| 2021 | 22,350 | 17,560 | 21,734 | 22,152 | 24,714 | 25,056 | 24,927 | 25,168 | 23,212 | 23,057 | 23,568 | 25,621 |
| 2022 | 23,779 | 21,800 | 24,420 | 24,415 | 25,439 | 25,634 | 25,832 | 25,447 | 24,271 | 24,394 | 24,940 | 24,214 |
| 2023 | 24,323 | 21,701 | 23,978 | 23,732 | 24,772 | 25,096 | 26,230 | 25,713 | 24,904 | 23,811 | 24,619 | 25,443 |
| 2024 | 23,961 | |||||||||||
| - = No Data Reported; -- = Not Applicable; NA = Not Available; W = Withheld to avoid disclosure of individual company data. |
| Release Date: 3/29/2024 |
| Next Release Date: 4/30/2024 |
Referring Pages: