|
Download Data (XLS File) |
|
||||||||
|
||||||||
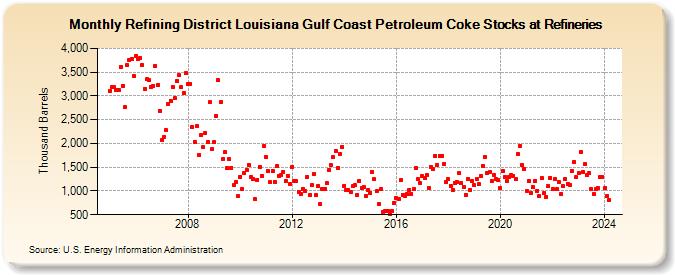
| Refining District Louisiana Gulf Coast Petroleum Coke Stocks at Refineries (Thousand Barrels) | ||||||||
| Year | Jan | Feb | Mar | Apr | May | Jun | Jul | Aug | Sep | Oct | Nov | Dec |
|---|---|---|---|---|---|---|---|---|---|---|---|---|
| 2005 | 3,111 | 3,195 | 3,181 | 3,119 | 3,122 | 3,612 | 3,217 | 2,765 | 3,650 | 3,765 | 3,785 | 3,423 |
| 2006 | 3,847 | 3,774 | 3,796 | 3,649 | 3,152 | 3,346 | 3,330 | 3,197 | 3,219 | 3,633 | 3,229 | 2,693 |
| 2007 | 2,080 | 2,144 | 2,273 | 2,838 | 2,903 | 3,191 | 2,946 | 3,320 | 3,430 | 3,182 | 3,058 | 3,479 |
| 2008 | 3,254 | 3,253 | 2,349 | 2,039 | 2,372 | 1,766 | 2,179 | 1,922 | 2,222 | 2,025 | 2,866 | 1,877 |
| 2009 | 2,022 | 2,585 | 3,329 | 2,862 | 1,664 | 1,815 | 1,480 | 1,672 | 1,491 | 1,121 | 1,180 | 887 |
| 2010 | 1,299 | 1,043 | 1,386 | 1,444 | 1,542 | 1,285 | 1,242 | 821 | 1,236 | 1,504 | 1,321 | 1,950 |
| 2011 | 1,716 | 1,412 | 1,181 | 1,424 | 1,194 | 1,517 | 1,322 | 1,332 | 1,399 | 1,211 | 1,321 | 1,143 |
| 2012 | 1,510 | 1,204 | 1,199 | 984 | 946 | 1,043 | 990 | 1,302 | 907 | 1,116 | 1,357 | 913 |
| 2013 | 1,107 | 718 | 1,044 | 1,046 | 1,158 | 1,437 | 1,536 | 1,715 | 1,839 | 1,489 | 1,778 | 1,920 |
| 2014 | 1,107 | 1,020 | 1,018 | 977 | 1,096 | 1,119 | 921 | 1,206 | 1,066 | 1,085 | 904 | 1,024 |
| 2015 | 957 | 1,402 | 1,242 | 992 | 722 | 1,040 | 567 | 576 | 571 | 522 | 571 | 757 |
| 2016 | 852 | 840 | 1,228 | 916 | 897 | 927 | 1,028 | 938 | 1,044 | 1,475 | 1,243 | 1,164 |
| 2017 | 1,319 | 1,270 | 1,333 | 1,072 | 1,507 | 1,458 | 1,742 | 1,548 | 1,730 | 1,736 | 1,572 | 1,180 |
| 2018 | 1,242 | 1,105 | 1,030 | 1,175 | 1,192 | 1,370 | 1,160 | 1,089 | 921 | 1,246 | 1,027 | 1,202 |
| 2019 | 1,115 | 1,253 | 1,140 | 1,316 | 1,531 | 1,715 | 1,368 | 1,393 | 1,200 | 1,339 | 1,257 | 1,238 |
| 2020 | 1,059 | 1,417 | 1,298 | 1,215 | 1,302 | 1,330 | 1,325 | 1,246 | 1,782 | 1,956 | 1,544 | 1,471 |
| 2021 | 1,001 | 1,206 | 950 | 1,080 | 1,217 | 1,005 | 892 | 1,276 | 951 | 879 | 1,107 | 1,278 |
| 2022 | 1,031 | 1,244 | 1,032 | 1,189 | 932 | 1,095 | 1,250 | 1,156 | 1,116 | 1,422 | 1,619 | 1,284 |
| 2023 | 1,376 | 1,554 | 1,404 | 1,571 | 1,331 | 1,387 | 1,031 | 939 | 1,035 | 1,057 | 1,298 | 1,300 |
| 2024 | 1,058 | 890 | 802 | 1,108 | 960 | 1,426 | ||||||
| - = No Data Reported; -- = Not Applicable; NA = Not Available; W = Withheld to avoid disclosure of individual company data. |
| Release Date: 8/30/2024 |
| Next Release Date: 9/30/2024 |
Referring Pages: