|
Download Data (XLS File) |
|
||||||||
|
||||||||
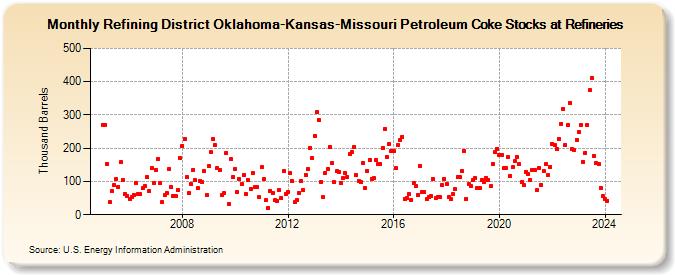
| Refining District Oklahoma-Kansas-Missouri Petroleum Coke Stocks at Refineries (Thousand Barrels) | ||||||||
| Year | Jan | Feb | Mar | Apr | May | Jun | Jul | Aug | Sep | Oct | Nov | Dec |
|---|---|---|---|---|---|---|---|---|---|---|---|---|
| 2005 | 271 | 269 | 153 | 37 | 70 | 90 | 108 | 84 | 157 | 105 | 62 | 57 |
| 2006 | 47 | 54 | 60 | 95 | 63 | 61 | 79 | 86 | 113 | 72 | 139 | 95 |
| 2007 | 135 | 168 | 95 | 37 | 58 | 64 | 138 | 84 | 57 | 55 | 75 | 171 |
| 2008 | 208 | 228 | 113 | 65 | 93 | 135 | 103 | 79 | 102 | 99 | 131 | 59 |
| 2009 | 146 | 188 | 227 | 209 | 139 | 134 | 58 | 64 | 185 | 32 | 166 | 113 |
| 2010 | 138 | 68 | 106 | 91 | 119 | 62 | 103 | 78 | 125 | 84 | 84 | 52 |
| 2011 | 142 | 107 | 43 | 20 | 72 | 64 | 43 | 41 | 73 | 50 | 132 | 61 |
| 2012 | 69 | 124 | 101 | 37 | 44 | 65 | 101 | 74 | 120 | 138 | 202 | 170 |
| 2013 | 238 | 308 | 286 | 99 | 52 | 126 | 137 | 204 | 155 | 98 | 130 | 128 |
| 2014 | 96 | 110 | 124 | 114 | 182 | 188 | 203 | 119 | 100 | 97 | 156 | 81 |
| 2015 | 131 | 164 | 108 | 109 | 164 | 152 | 151 | 200 | 259 | 175 | 213 | 191 |
| 2016 | 192 | 139 | 210 | 226 | 235 | 47 | 50 | 61 | 45 | 95 | 86 | 60 |
| 2017 | 147 | 67 | 67 | 47 | 54 | 55 | 108 | 49 | 54 | 53 | 88 | 107 |
| 2018 | 92 | 53 | 46 | 61 | 76 | 114 | 112 | 132 | 191 | 48 | 92 | 86 |
| 2019 | 103 | 110 | 79 | 79 | 103 | 99 | 111 | 105 | 85 | 153 | 188 | 199 |
| 2020 | 180 | 181 | 139 | 140 | 172 | 116 | 142 | 161 | 173 | 151 | 97 | 88 |
| 2021 | 129 | 122 | 105 | 134 | 135 | 73 | 141 | 90 | 130 | 152 | 119 | 144 |
| 2022 | 214 | 209 | 198 | 229 | 273 | 318 | 209 | 269 | 337 | 198 | 194 | 225 |
| 2023 | 248 | 270 | 159 | 187 | 270 | 374 | 411 | 178 | 156 | 152 | 81 | 56 |
| 2024 | 46 | 42 | ||||||||||
| - = No Data Reported; -- = Not Applicable; NA = Not Available; W = Withheld to avoid disclosure of individual company data. |
| Release Date: 4/30/2024 |
| Next Release Date: 5/31/2024 |