|
Download Data (XLS File) |
|
||||||||
|
||||||||
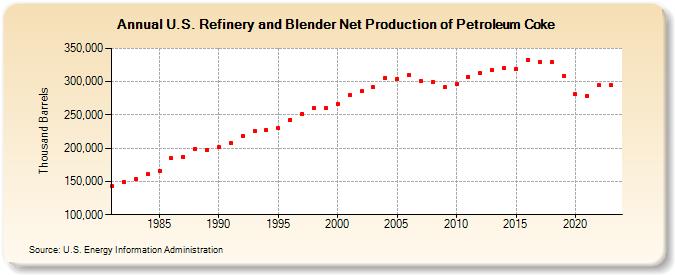
| U.S. Refinery and Blender Net Production of Petroleum Coke (Thousand Barrels) | ||||||||
| Decade | Year-0 | Year-1 | Year-2 | Year-3 | Year-4 | Year-5 | Year-6 | Year-7 | Year-8 | Year-9 |
|---|---|---|---|---|---|---|---|---|---|---|
| 1980's | 142,430 | 149,538 | 153,305 | 160,655 | 166,019 | 184,513 | 186,902 | 199,056 | 197,665 | |
| 1990's | 201,660 | 207,463 | 217,988 | 226,016 | 227,059 | 229,955 | 242,985 | 251,619 | 260,061 | 260,115 |
| 2000's | 266,107 | 280,077 | 285,226 | 291,376 | 306,065 | 304,730 | 309,431 | 300,570 | 299,253 | 291,615 |
| 2010's | 296,383 | 307,668 | 312,346 | 317,819 | 320,364 | 318,834 | 333,124 | 329,170 | 328,965 | 308,044 |
| 2020's | 280,816 | 279,119 | 294,585 | 294,322 |
| - = No Data Reported; -- = Not Applicable; NA = Not Available; W = Withheld to avoid disclosure of individual company data. |
| Release Date: 3/29/2024 |
| Next Release Date: 8/30/2024 |