|
Download Data (XLS File) |
|
||||||||
|
||||||||
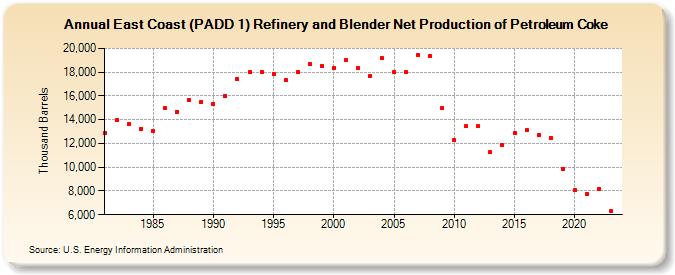
| East Coast (PADD 1) Refinery and Blender Net Production of Petroleum Coke (Thousand Barrels) | ||||||||
| Decade | Year-0 | Year-1 | Year-2 | Year-3 | Year-4 | Year-5 | Year-6 | Year-7 | Year-8 | Year-9 |
|---|---|---|---|---|---|---|---|---|---|---|
| 1980's | 12,845 | 13,942 | 13,619 | 13,250 | 13,041 | 14,944 | 14,672 | 15,677 | 15,524 | |
| 1990's | 15,357 | 15,998 | 17,392 | 17,987 | 18,016 | 17,849 | 17,353 | 18,011 | 18,715 | 18,504 |
| 2000's | 18,384 | 18,983 | 18,323 | 17,711 | 19,188 | 18,039 | 18,009 | 19,432 | 19,336 | 14,984 |
| 2010's | 12,286 | 13,437 | 13,431 | 11,252 | 11,865 | 12,867 | 13,092 | 12,733 | 12,458 | 9,852 |
| 2020's | 8,042 | 7,753 | 8,182 | 6,762 |
| - = No Data Reported; -- = Not Applicable; NA = Not Available; W = Withheld to avoid disclosure of individual company data. |
| Release Date: 8/30/2024 |
| Next Release Date: 8/29/2025 |