|
Download Data (XLS File) |
|
||||||||
|
||||||||
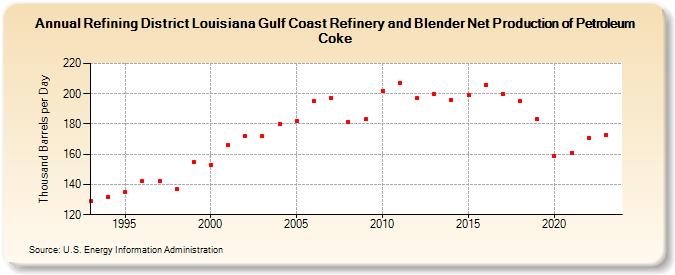
| Refining District Louisiana Gulf Coast Refinery and Blender Net Production of Petroleum Coke (Thousand Barrels per Day) | ||||||||
| Decade | Year-0 | Year-1 | Year-2 | Year-3 | Year-4 | Year-5 | Year-6 | Year-7 | Year-8 | Year-9 |
|---|---|---|---|---|---|---|---|---|---|---|
| 1990's | 129 | 132 | 135 | 142 | 142 | 137 | 155 | |||
| 2000's | 153 | 166 | 172 | 172 | 180 | 182 | 195 | 197 | 181 | 183 |
| 2010's | 202 | 207 | 197 | 200 | 196 | 199 | 206 | 200 | 195 | 183 |
| 2020's | 159 | 161 | 171 | 172 |
| - = No Data Reported; -- = Not Applicable; NA = Not Available; W = Withheld to avoid disclosure of individual company data. |
| Release Date: 8/30/2024 |
| Next Release Date: 8/29/2025 |