|
Download Data (XLS File) |
|
||||||||
|
||||||||
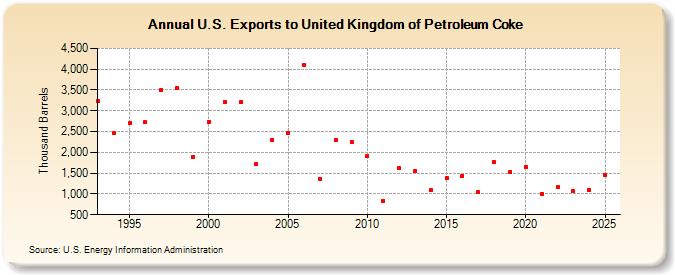
| U.S. Exports to United Kingdom of Petroleum Coke (Thousand Barrels) | ||||||||
| Decade | Year-0 | Year-1 | Year-2 | Year-3 | Year-4 | Year-5 | Year-6 | Year-7 | Year-8 | Year-9 |
|---|---|---|---|---|---|---|---|---|---|---|
| 1990's | 3,231 | 2,455 | 2,695 | 2,719 | 3,497 | 3,541 | 1,888 | |||
| 2000's | 2,735 | 3,217 | 3,201 | 1,717 | 2,307 | 2,463 | 4,111 | 1,360 | 2,295 | 2,250 |
| 2010's | 1,907 | 840 | 1,615 | 1,558 | 1,088 | 1,373 | 1,440 | 1,038 | 1,767 | 1,537 |
| 2020's | 1,648 | 1,010 | 1,178 | 1,064 |
| - = No Data Reported; -- = Not Applicable; NA = Not Available; W = Withheld to avoid disclosure of individual company data. |
| Release Date: 8/30/2024 |
| Next Release Date: 8/29/2025 |