|
Download Data (XLS File) |
|
||||||||
|
||||||||
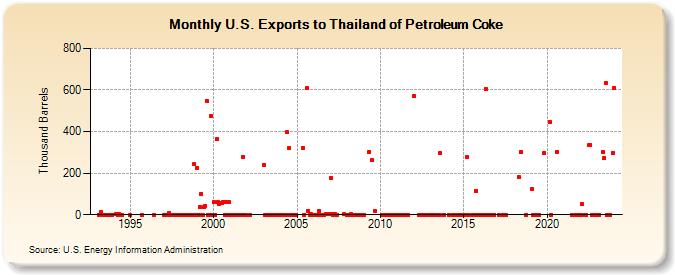
| U.S. Exports to Thailand of Petroleum Coke (Thousand Barrels) | ||||||||
| Year | Jan | Feb | Mar | Apr | May | Jun | Jul | Aug | Sep | Oct | Nov | Dec |
|---|---|---|---|---|---|---|---|---|---|---|---|---|
| 1993 | 0 | 12 | 0 | 0 | 0 | 0 | 0 | 0 | 0 | |||
| 1994 | 3 | 0 | 3 | 1 | ||||||||
| 1995 | 0 | 0 | ||||||||||
| 1996 | 0 | |||||||||||
| 1997 | 0 | 0 | 0 | 0 | 6 | 0 | 0 | 0 | 0 | 0 | 0 | 0 |
| 1998 | 0 | 0 | 0 | 0 | 0 | 0 | 0 | 0 | 0 | 0 | 244 | 0 |
| 1999 | 226 | 0 | 38 | 101 | 0 | 36 | 43 | 547 | 0 | 0 | 476 | 0 |
| 2000 | 59 | 0 | 363 | 61 | 53 | 57 | 54 | 61 | 0 | 59 | 0 | 59 |
| 2001 | 0 | 0 | 0 | 0 | 0 | 0 | 0 | 0 | 0 | 279 | 0 | 0 |
| 2002 | 0 | |||||||||||
| 2003 | 240 | 0 | 0 | 0 | 0 | 0 | 0 | 0 | 0 | 0 | 0 | 0 |
| 2004 | 0 | 0 | 0 | 0 | 0 | 396 | 320 | 0 | 0 | 0 | 0 | 0 |
| 2005 | 323 | 1 | 608 | 18 | 1 | 3 | 1 | |||||
| 2006 | 0 | 0 | 1 | 19 | 0 | 0 | 3 | 2 | 3 | |||
| 2007 | 178 | 3 | 1 | 2 | 1 | 2 | ||||||
| 2008 | 1 | 0 | 1 | 2 | 1 | 0 | 1 | 1 | 1 | 1 | 0 | |
| 2009 | 0 | 302 | 263 | 19 | ||||||||
| 2010 | 0 | 0 | 1 | 1 | 0 | 0 | 1 | 1 | 0 | 0 | 0 | |
| 2011 | 0 | 1 | 1 | 1 | 1 | 1 | 1 | 0 | 0 | |||
| 2012 | 570 | 0 | 1 | 0 | 1 | 0 | 0 | 0 | ||||
| 2013 | 0 | 0 | 1 | 1 | 1 | 1 | 297 | 0 | 0 | |||
| 2014 | 0 | 0 | 0 | 0 | 0 | 1 | 0 | 0 | ||||
| 2015 | 0 | 278 | 0 | 0 | 0 | 116 | 0 | 0 | ||||
| 2016 | 1 | 0 | 0 | 1 | 604 | 0 | 0 | 0 | 0 | 0 | ||
| 2017 | 0 | 0 | 0 | |||||||||
| 2018 | 179 | 303 | 0 | |||||||||
| 2019 | 122 | 0 | 0 | 0 | 0 | 298 | ||||||
| 2020 | 446 | 0 | 303 | |||||||||
| 2021 | 0 | 0 | 1 | |||||||||
| 2022 | 1 | 50 | 0 | 0 | 333 | 336 | 0 | 0 | 0 | |||
| 2023 | 0 | 303 | 272 | 635 | 0 | 0 | 295 | |||||
| 2024 | 611 | |||||||||||
| - = No Data Reported; -- = Not Applicable; NA = Not Available; W = Withheld to avoid disclosure of individual company data. |
| Release Date: 3/29/2024 |
| Next Release Date: 4/30/2024 |