|
Download Data (XLS File) |
|
||||||||
|
||||||||
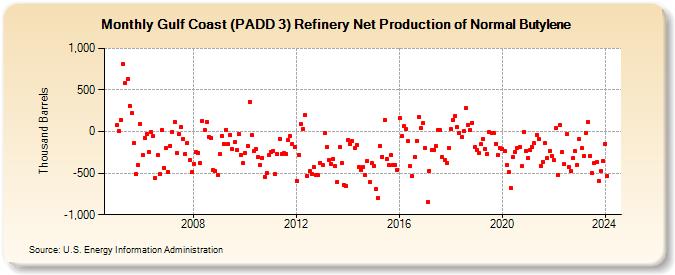
| Gulf Coast (PADD 3) Refinery Net Production of Normal Butylene (Thousand Barrels) | ||||||||
| Year | Jan | Feb | Mar | Apr | May | Jun | Jul | Aug | Sep | Oct | Nov | Dec |
|---|---|---|---|---|---|---|---|---|---|---|---|---|
| 2005 | 78 | 6 | 143 | 807 | 579 | 631 | 311 | 219 | -139 | -516 | -404 | 86 |
| 2006 | -283 | -76 | -29 | -249 | -10 | -51 | -554 | -281 | -515 | 22 | -435 | -198 |
| 2007 | -487 | -168 | 0 | 117 | -255 | -32 | 54 | -87 | -268 | -138 | -342 | -490 |
| 2008 | -387 | -244 | -253 | -383 | 128 | 17 | 115 | -65 | -73 | -467 | -476 | -525 |
| 2009 | -275 | -49 | -146 | 22 | -149 | -40 | -215 | -131 | -216 | -31 | -277 | -380 |
| 2010 | -256 | -178 | 361 | -46 | -239 | -206 | -307 | -400 | -315 | -543 | -495 | -287 |
| 2011 | -240 | -230 | -513 | -275 | -85 | -264 | -262 | -264 | -97 | -53 | -155 | -182 |
| 2012 | -593 | -278 | 90 | 31 | 199 | -529 | -478 | -510 | -429 | -523 | -528 | -375 |
| 2013 | -400 | -19 | -184 | -341 | -386 | -330 | -418 | -603 | -184 | -377 | -641 | -650 |
| 2014 | -97 | -149 | -119 | -196 | -160 | -431 | -467 | -429 | -526 | -354 | -607 | -384 |
| 2015 | -417 | -689 | -798 | -170 | -302 | 140 | -331 | -406 | -287 | -400 | -400 | -457 |
| 2016 | 160 | -58 | 61 | 29 | -118 | -415 | -538 | -310 | -108 | 180 | 41 | 101 |
| 2017 | -192 | -845 | -470 | -223 | -216 | -179 | 17 | 13 | -311 | -347 | -377 | -196 |
| 2018 | 26 | 143 | 190 | 49 | -17 | -71 | 3 | 281 | 79 | 16 | 106 | -186 |
| 2019 | -224 | -261 | -154 | -84 | -208 | -268 | -11 | -18 | -12 | -144 | -284 | -200 |
| 2020 | -205 | -234 | -401 | -492 | -684 | -301 | -240 | -193 | -185 | -420 | -2 | -230 |
| 2021 | -316 | -221 | -191 | -143 | -41 | -86 | -409 | -361 | -142 | -323 | -229 | -293 |
| 2022 | -341 | 40 | -518 | 77 | -248 | -394 | -30 | -422 | -479 | -321 | -239 | -404 |
| 2023 | -87 | -201 | -296 | -12 | 114 | -291 | -502 | -376 | -370 | -592 | -473 | -360 |
| 2024 | -146 | |||||||||||
| - = No Data Reported; -- = Not Applicable; NA = Not Available; W = Withheld to avoid disclosure of individual company data. |
| Release Date: 3/29/2024 |
| Next Release Date: 4/30/2024 |
Referring Pages: