|
Download Data (XLS File) |
|
||||||||
|
||||||||
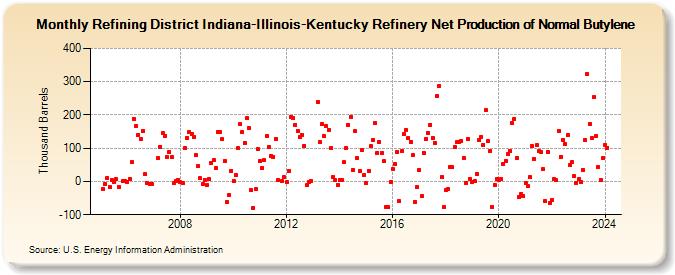
| Refining District Indiana-Illinois-Kentucky Refinery Net Production of Normal Butylene (Thousand Barrels) | ||||||||
| Year | Jan | Feb | Mar | Apr | May | Jun | Jul | Aug | Sep | Oct | Nov | Dec |
|---|---|---|---|---|---|---|---|---|---|---|---|---|
| 2005 | -22 | -8 | 11 | -16 | 5 | -1 | 6 | -16 | 1 | 1 | ||
| 2006 | -1 | 7 | 57 | 189 | 167 | 141 | 129 | 151 | 21 | -5 | -7 | -7 |
| 2007 | 70 | 105 | 145 | 138 | 74 | 90 | 72 | -5 | 1 | 5 | ||
| 2008 | -3 | -5 | 100 | 132 | 148 | 143 | 135 | 79 | 46 | 9 | -9 | 5 |
| 2009 | -10 | 6 | 55 | 63 | 41 | 148 | 149 | 127 | 62 | -62 | -40 | 32 |
| 2010 | 0 | 20 | 100 | 172 | 148 | 117 | 190 | 160 | -26 | -79 | -24 | 98 |
| 2011 | 61 | 41 | 64 | 137 | 103 | 77 | 73 | 129 | 4 | 2 | 12 | |
| 2012 | -3 | 32 | 195 | 192 | 171 | 153 | 134 | 141 | 108 | -11 | -3 | 0 |
| 2013 | 239 | 118 | 173 | 136 | 166 | 156 | 101 | 13 | 3 | -10 | ||
| 2014 | 4 | 4 | 57 | 101 | 171 | 195 | 35 | 151 | 69 | 31 | 95 | 20 |
| 2015 | -6 | 32 | 106 | 126 | 175 | 87 | 119 | 86 | 60 | -76 | -77 | -2 |
| 2016 | 38 | 53 | 89 | -60 | 91 | 142 | 154 | 130 | 120 | 79 | -61 | -17 |
| 2017 | 35 | -45 | 87 | 129 | 147 | 171 | 131 | 117 | 257 | 288 | 14 | -77 |
| 2018 | -26 | -23 | 43 | 42 | 104 | 118 | 120 | 121 | 71 | -5 | 128 | 6 |
| 2019 | -1 | 0 | 23 | 124 | 135 | 111 | 214 | 123 | 93 | -76 | -11 | 8 |
| 2020 | 3 | 8 | 52 | 62 | 83 | 93 | 176 | 189 | 70 | -46 | -37 | -43 |
| 2021 | -6 | -13 | 12 | 106 | 68 | 109 | 91 | 89 | 36 | -60 | 89 | -64 |
| 2022 | -57 | 7 | 3 | 153 | 75 | 126 | 113 | 139 | 49 | 57 | 16 | -4 |
| 2023 | 7 | -1 | 35 | 124 | 323 | 174 | 131 | 254 | 136 | 43 | 4 | 71 |
| 2024 | 110 | |||||||||||
| - = No Data Reported; -- = Not Applicable; NA = Not Available; W = Withheld to avoid disclosure of individual company data. |
| Release Date: 3/29/2024 |
| Next Release Date: 4/30/2024 |