|
Download Data (XLS File) |
|
||||||||
|
||||||||
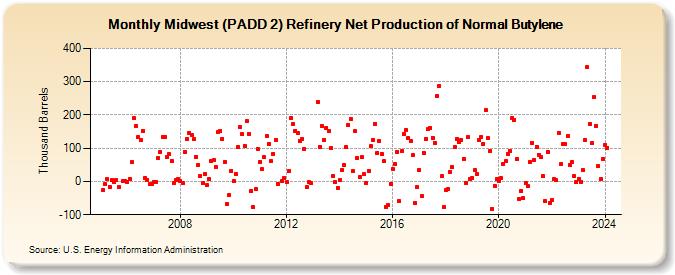
| Midwest (PADD 2) Refinery Net Production of Normal Butylene (Thousand Barrels) | ||||||||
| Year | Jan | Feb | Mar | Apr | May | Jun | Jul | Aug | Sep | Oct | Nov | Dec |
|---|---|---|---|---|---|---|---|---|---|---|---|---|
| 2005 | -26 | -9 | 6 | -16 | 5 | -2 | 4 | -16 | 1 | 2 | ||
| 2006 | -2 | 7 | 57 | 190 | 167 | 134 | 126 | 153 | 11 | 4 | -9 | -7 |
| 2007 | -1 | -1 | 70 | 89 | 135 | 133 | 72 | 82 | 62 | -6 | 5 | 6 |
| 2008 | 0 | -6 | 89 | 129 | 147 | 141 | 127 | 75 | 49 | 16 | -5 | 23 |
| 2009 | -11 | 8 | 61 | 64 | 44 | 149 | 152 | 129 | 59 | -68 | -40 | 32 |
| 2010 | 0 | 23 | 104 | 165 | 143 | 107 | 181 | 144 | -28 | -78 | -23 | 99 |
| 2011 | 59 | 36 | 72 | 138 | 114 | 61 | 84 | 124 | -7 | 2 | 11 | |
| 2012 | -3 | 32 | 192 | 173 | 153 | 146 | 123 | 129 | 98 | -18 | -3 | -4 |
| 2013 | 239 | 105 | 168 | 126 | 162 | 153 | 101 | 17 | -1 | -19 | ||
| 2014 | 4 | 35 | 50 | 103 | 171 | 188 | 30 | 151 | 69 | 12 | 72 | 21 |
| 2015 | -6 | 32 | 106 | 125 | 174 | 87 | 121 | 84 | 60 | -76 | -72 | -7 |
| 2016 | 38 | 52 | 90 | -60 | 91 | 142 | 154 | 130 | 123 | 79 | -64 | -18 |
| 2017 | 35 | -45 | 87 | 129 | 157 | 161 | 132 | 117 | 257 | 288 | 15 | -77 |
| 2018 | -26 | -22 | 29 | 42 | 103 | 127 | 118 | 124 | 68 | -5 | 133 | 7 |
| 2019 | 10 | 33 | 21 | 124 | 135 | 113 | 214 | 131 | 93 | -82 | -13 | 6 |
| 2020 | 2 | 9 | 53 | 60 | 84 | 92 | 191 | 185 | 67 | -54 | -28 | -51 |
| 2021 | -6 | -14 | 58 | 117 | 65 | 104 | 81 | 72 | 16 | -60 | 89 | -64 |
| 2022 | -57 | 7 | 3 | 146 | 51 | 113 | 113 | 138 | 50 | 57 | 16 | -3 |
| 2023 | 7 | -1 | 34 | 124 | 344 | 173 | 115 | 254 | 168 | 46 | 6 | 68 |
| 2024 | 111 | 101 | 106 | 156 | 160 | 144 | ||||||
| - = No Data Reported; -- = Not Applicable; NA = Not Available; W = Withheld to avoid disclosure of individual company data. |
| Release Date: 8/30/2024 |
| Next Release Date: 9/30/2024 |
Referring Pages: