|
Download Data (XLS File) |
|
||||||||
|
||||||||
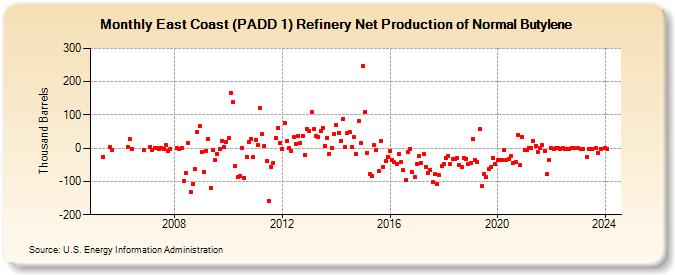
| East Coast (PADD 1) Refinery Net Production of Normal Butylene (Thousand Barrels) | ||||||||
| Year | Jan | Feb | Mar | Apr | May | Jun | Jul | Aug | Sep | Oct | Nov | Dec |
|---|---|---|---|---|---|---|---|---|---|---|---|---|
| 2005 | -25 | 4 | -6 | |||||||||
| 2006 | 4 | 29 | -3 | -4 | ||||||||
| 2007 | 5 | -5 | 1 | 1 | -1 | 1 | -2 | 9 | -8 | -1 | ||
| 2008 | 1 | -1 | 1 | -99 | -75 | 15 | -131 | -108 | -63 | 49 | 67 | |
| 2009 | -12 | -72 | -7 | 28 | -120 | -6 | -36 | -17 | -1 | 21 | 3 | 18 |
| 2010 | 32 | 166 | 138 | -54 | -86 | -84 | 2 | -90 | -26 | 18 | 28 | -26 |
| 2011 | 26 | 10 | 121 | 44 | 8 | -38 | -160 | -58 | -45 | 32 | 61 | 15 |
| 2012 | -3 | 77 | 21 | 0 | -9 | 33 | 12 | 37 | 17 | 38 | -20 | 59 |
| 2013 | 52 | 109 | 57 | 38 | 33 | 52 | 60 | 7 | 32 | -16 | 1 | 43 |
| 2014 | 70 | 47 | 23 | 88 | 5 | 45 | 50 | 5 | 34 | -16 | 82 | 17 |
| 2015 | 247 | 110 | -14 | -79 | -84 | 10 | -6 | -68 | 21 | -57 | -40 | -25 |
| 2016 | -7 | -35 | -43 | -48 | -18 | -41 | -67 | -96 | -12 | -2 | -73 | -86 |
| 2017 | -47 | -23 | -45 | -18 | -57 | -74 | -65 | -103 | -78 | -109 | -82 | -55 |
| 2018 | -47 | -30 | -24 | -48 | -32 | -32 | -31 | -50 | -56 | -29 | -34 | -49 |
| 2019 | -45 | 27 | -36 | -41 | 57 | -114 | -78 | -88 | -63 | -58 | -30 | -48 |
| 2020 | -37 | -37 | -36 | -6 | -36 | -33 | -24 | -46 | -41 | 40 | -52 | 33 |
| 2021 | -4 | -5 | 2 | 2 | 21 | 8 | -10 | 0 | 9 | -8 | -79 | -37 |
| 2022 | 2 | -3 | 1 | 2 | -1 | 1 | -2 | -1 | -1 | 1 | 1 | |
| 2023 | 1 | -1 | -2 | -28 | -2 | -2 | 1 | -13 | -1 | |||
| 2024 | 2 | |||||||||||
| - = No Data Reported; -- = Not Applicable; NA = Not Available; W = Withheld to avoid disclosure of individual company data. |
| Release Date: 3/29/2024 |
| Next Release Date: 4/30/2024 |
Referring Pages: