|
Download Data (XLS File) |
|
||||||||
|
||||||||
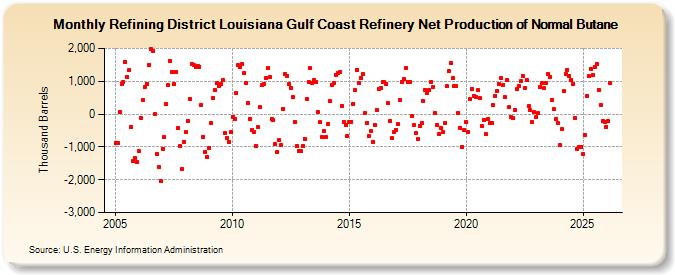
| Refining District Louisiana Gulf Coast Refinery Net Production of Normal Butane (Thousand Barrels) | ||||||||
| Year | Jan | Feb | Mar | Apr | May | Jun | Jul | Aug | Sep | Oct | Nov | Dec |
|---|---|---|---|---|---|---|---|---|---|---|---|---|
| 2005 | -879 | -870 | 73 | 930 | 972 | 1,593 | 1,142 | 1,339 | -381 | -1,437 | -1,351 | -1,464 |
| 2006 | -1,129 | -126 | 423 | 826 | 920 | 1,503 | 1,980 | 1,907 | -13 | -1,222 | -1,613 | -2,036 |
| 2007 | -1,056 | -698 | 307 | 879 | 1,629 | 1,275 | 913 | 1,276 | -423 | -970 | -1,669 | -837 |
| 2008 | -559 | -202 | 464 | 1,517 | 1,488 | 1,447 | 1,469 | 1,442 | 281 | -691 | -1,146 | -1,315 |
| 2009 | -975 | -270 | 460 | 622 | 802 | 745 | 965 | 1,077 | -450 | -690 | -807 | -556 |
| 2010 | -77 | -163 | 646 | 1,483 | 1,437 | 1,524 | 1,255 | 943 | 322 | -140 | -489 | -560 |
| 2011 | -958 | -406 | 207 | 882 | 907 | 1,093 | 1,403 | 1,115 | -150 | -187 | -922 | -1,167 |
| 2012 | -794 | -930 | 162 | 1,223 | 1,153 | 914 | 806 | 513 | -241 | -979 | -1,119 | -1,137 |
| 2013 | -964 | -747 | 472 | 970 | 1,395 | 958 | 1,040 | 988 | 51 | -243 | -692 | -517 |
| 2014 | -704 | -288 | 383 | 896 | 946 | 1,198 | 1,247 | 1,292 | 254 | -238 | -331 | -659 |
| 2015 | -252 | -231 | 317 | 719 | 1,351 | 933 | 1,111 | 1,210 | 29 | -264 | -663 | -522 |
| 2016 | -840 | -326 | 138 | 769 | 786 | 973 | 966 | 918 | 324 | -208 | -732 | -544 |
| 2017 | -471 | -309 | 429 | 987 | 1,069 | 1,415 | 989 | 990 | -53 | -347 | -585 | -767 |
| 2018 | -359 | -276 | 384 | 747 | 636 | 731 | 988 | 821 | 24 | -331 | -621 | -422 |
| 2019 | -561 | -269 | 845 | 1,306 | 1,549 | 1,095 | 868 | 854 | 35 | -411 | -1,007 | -491 |
| 2020 | -247 | -542 | 448 | 777 | 562 | 532 | 724 | 480 | -371 | -172 | -616 | -158 |
| 2021 | -261 | -286 | 262 | 563 | 717 | 928 | 1,084 | 894 | 509 | 1,046 | 205 | -94 |
| 2022 | -121 | 135 | 767 | 859 | 992 | 1,168 | 798 | 1,052 | 242 | 117 | -241 | 55 |
| 2023 | -78 | 29 | 837 | 950 | 784 | 946 | 1,225 | 1,141 | 443 | 142 | -147 | -273 |
| 2024 | 28 | |||||||||||
| - = No Data Reported; -- = Not Applicable; NA = Not Available; W = Withheld to avoid disclosure of individual company data. |
| Release Date: 3/29/2024 |
| Next Release Date: 4/30/2024 |