|
Download Data (XLS File) |
|
||||||||
|
||||||||
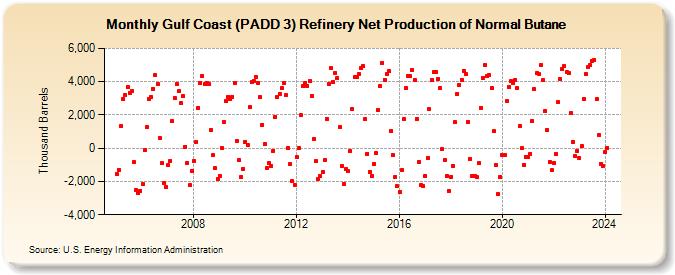
| Gulf Coast (PADD 3) Refinery Net Production of Normal Butane (Thousand Barrels) | ||||||||
| Year | Jan | Feb | Mar | Apr | May | Jun | Jul | Aug | Sep | Oct | Nov | Dec |
|---|---|---|---|---|---|---|---|---|---|---|---|---|
| 2005 | -1,563 | -1,296 | 1,331 | 2,950 | 3,213 | 3,676 | 3,333 | 3,410 | -842 | -2,501 | -2,704 | -2,556 |
| 2006 | -2,183 | -97 | 1,251 | 2,958 | 3,071 | 3,576 | 4,390 | 3,852 | 623 | -917 | -2,120 | -2,326 |
| 2007 | -1,018 | -763 | 1,622 | 3,004 | 3,855 | 3,423 | 2,695 | 3,129 | 98 | -870 | -2,223 | -1,350 |
| 2008 | -769 | 347 | 2,436 | 3,902 | 4,352 | 3,840 | 3,932 | 3,850 | 1,083 | -437 | -1,213 | -1,839 |
| 2009 | -1,393 | 74 | 1,748 | 2,825 | 3,238 | 3,003 | 3,321 | 4,076 | 655 | -685 | -1,464 | -853 |
| 2010 | 376 | 173 | 2,474 | 3,991 | 4,069 | 4,303 | 3,926 | 3,049 | 1,395 | 241 | -1,181 | -916 |
| 2011 | -1,071 | -155 | 1,876 | 3,055 | 3,273 | 3,595 | 3,917 | 3,173 | 17 | -968 | -1,979 | -2,188 |
| 2012 | -535 | 25 | 1,974 | 3,722 | 3,944 | 3,755 | 4,048 | 3,145 | 555 | -766 | -1,845 | -1,687 |
| 2013 | -1,437 | -734 | 1,771 | 3,877 | 4,832 | 3,985 | 4,532 | 4,210 | 1,246 | -1,056 | -2,158 | -1,259 |
| 2014 | -1,398 | -148 | 2,356 | 4,256 | 4,307 | 4,461 | 4,797 | 4,936 | 1,734 | -326 | -1,420 | -1,658 |
| 2015 | -933 | -315 | 2,299 | 3,742 | 5,148 | 4,116 | 4,485 | 4,611 | 1,057 | -413 | -1,725 | -2,289 |
| 2016 | -2,620 | -1,323 | 1,751 | 3,626 | 4,350 | 4,317 | 4,727 | 4,111 | 1,781 | -827 | -2,207 | -2,277 |
| 2017 | -1,660 | -584 | 2,340 | 4,071 | 4,565 | 4,569 | 4,171 | 3,596 | -63 | -686 | -1,672 | -2,552 |
| 2018 | -1,720 | -1,075 | 1,553 | 3,279 | 3,791 | 4,119 | 4,659 | 4,457 | 1,571 | -635 | -1,660 | -1,652 |
| 2019 | -1,735 | -913 | 2,417 | 4,223 | 4,987 | 4,354 | 4,387 | 3,627 | 1,005 | -986 | -2,772 | -1,729 |
| 2020 | -438 | -404 | 2,814 | 3,700 | 4,016 | 3,924 | 4,121 | 3,617 | 1,322 | -10 | -983 | -513 |
| 2021 | -511 | -329 | 1,635 | 3,557 | 4,499 | 4,486 | 5,015 | 4,089 | 2,222 | 1,101 | -812 | -1,327 |
| 2022 | -888 | -349 | 2,749 | 4,173 | 4,771 | 4,921 | 4,567 | 4,496 | 2,112 | 380 | -478 | -154 |
| 2023 | -576 | 104 | 2,950 | 4,465 | 4,854 | 4,973 | 5,260 | 5,277 | 2,947 | 776 | -923 | -1,087 |
| 2024 | -253 | |||||||||||
| - = No Data Reported; -- = Not Applicable; NA = Not Available; W = Withheld to avoid disclosure of individual company data. |
| Release Date: 3/29/2024 |
| Next Release Date: 4/30/2024 |
Referring Pages: