|
Download Data (XLS File) |
|
||||||||
|
||||||||
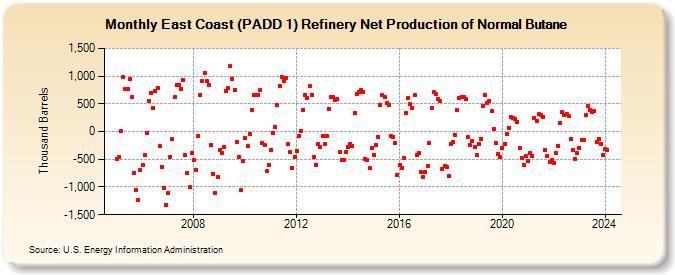
| East Coast (PADD 1) Refinery Net Production of Normal Butane (Thousand Barrels) | ||||||||
| Year | Jan | Feb | Mar | Apr | May | Jun | Jul | Aug | Sep | Oct | Nov | Dec |
|---|---|---|---|---|---|---|---|---|---|---|---|---|
| 2005 | -497 | -455 | 11 | 981 | 770 | 776 | 941 | 616 | -752 | -1,051 | -1,233 | -692 |
| 2006 | -607 | -424 | -21 | 554 | 699 | 418 | 723 | 786 | -258 | -633 | -1,025 | -1,317 |
| 2007 | -1,105 | -456 | -137 | 618 | 842 | 847 | 773 | 937 | -427 | -746 | -1,006 | -393 |
| 2008 | -520 | -688 | -72 | 665 | 913 | 1,056 | 914 | 842 | -248 | -761 | -1,107 | -817 |
| 2009 | -329 | -319 | -264 | 701 | 901 | 1,181 | 976 | 764 | -194 | -472 | -1,063 | -558 |
| 2010 | -121 | -255 | -38 | 387 | 653 | 668 | 667 | 758 | -214 | -249 | -719 | -595 |
| 2011 | -333 | -19 | 75 | 480 | 828 | 989 | 907 | 972 | -232 | -370 | -657 | -454 |
| 2012 | -342 | -77 | 15 | 390 | 668 | 613 | 817 | 657 | -464 | -597 | -228 | -279 |
| 2013 | -89 | -217 | -79 | 411 | 621 | 619 | 561 | 581 | -365 | -519 | -521 | -370 |
| 2014 | -282 | -217 | -256 | 335 | 683 | 712 | 748 | 722 | -504 | -516 | -655 | -290 |
| 2015 | -415 | -240 | -93 | 477 | 653 | 627 | 513 | 472 | -81 | -95 | -210 | -775 |
| 2016 | -602 | -663 | -474 | 334 | 607 | 490 | 424 | 657 | -417 | -378 | -738 | -820 |
| 2017 | -722 | -617 | -210 | 425 | 709 | 671 | 591 | 550 | -670 | -621 | -635 | -796 |
| 2018 | -219 | -193 | -65 | 380 | 613 | 629 | 624 | 596 | -94 | -250 | -175 | -277 |
| 2019 | -419 | -222 | -128 | 461 | 658 | 511 | 560 | 372 | 47 | -205 | -403 | -461 |
| 2020 | -303 | -233 | -40 | 66 | 266 | 240 | 229 | 180 | -301 | -476 | -599 | -447 |
| 2021 | -535 | -385 | -434 | 245 | 182 | 312 | 303 | 259 | -336 | -436 | -554 | -520 |
| 2022 | -560 | -387 | -255 | 149 | 345 | 307 | 314 | 282 | -126 | -341 | -502 | -384 |
| 2023 | -296 | -152 | -152 | 291 | 453 | 390 | 357 | 367 | -191 | -127 | -228 | -431 |
| 2024 | -306 | |||||||||||
| - = No Data Reported; -- = Not Applicable; NA = Not Available; W = Withheld to avoid disclosure of individual company data. |
| Release Date: 3/29/2024 |
| Next Release Date: 4/30/2024 |
Referring Pages: