|
Download Data (XLS File) |
|
||||||||
|
||||||||
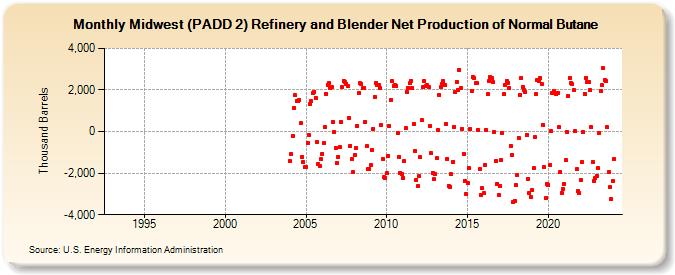
| Midwest (PADD 2) Refinery and Blender Net Production of Normal Butane (Thousand Barrels) | ||||||||
| Year | Jan | Feb | Mar | Apr | May | Jun | Jul | Aug | Sep | Oct | Nov | Dec |
|---|---|---|---|---|---|---|---|---|---|---|---|---|
| 1993 | W | W | W | W | W | W | W | W | W | W | W | W |
| 1994 | W | W | W | W | W | W | W | W | W | W | W | W |
| 1995 | W | W | W | W | W | W | W | W | W | W | W | W |
| 1996 | W | W | W | W | W | W | W | W | W | W | W | W |
| 1997 | W | W | W | W | W | W | W | W | W | W | W | W |
| 1998 | W | W | W | W | W | W | W | W | W | W | W | W |
| 1999 | W | W | W | W | W | W | W | W | W | W | W | W |
| 2000 | W | W | W | W | W | W | W | W | W | W | W | W |
| 2001 | W | W | W | W | W | W | W | W | W | W | W | W |
| 2002 | W | W | W | W | W | W | W | W | W | W | W | W |
| 2003 | W | W | W | W | W | W | W | W | W | W | W | W |
| 2004 | -1,417 | -1,086 | -222 | 1,152 | 1,744 | 1,470 | 1,480 | 1,520 | 395 | -1,218 | -1,475 | -1,710 |
| 2005 | -1,695 | -554 | -160 | 1,306 | 1,456 | 1,840 | 1,919 | 1,620 | -521 | -1,567 | -1,642 | -1,333 |
| 2006 | -1,064 | -549 | 197 | 1,827 | 2,254 | 2,338 | 2,078 | 2,141 | 450 | -20 | -790 | -1,496 |
| 2007 | -1,210 | -757 | 457 | 2,135 | 2,445 | 2,379 | 2,302 | 2,198 | 642 | -672 | -1,322 | -1,961 |
| 2008 | -1,108 | -807 | 261 | 1,872 | 2,321 | 2,290 | 2,090 | 2,118 | 480 | -715 | -1,815 | -1,788 |
| 2009 | -1,621 | -893 | 67 | 1,617 | 2,308 | 2,084 | 2,085 | 1,951 | 252 | -1,236 | -2,150 | -2,243 |
| 2010 | -2,006 | -1,159 | 284 | 1,532 | 2,414 | 2,191 | 2,259 | 2,191 | -58 | -1,201 | -1,980 | -2,023 |
| 2011 | -2,213 | -1,431 | 159 | 1,909 | 2,114 | 2,314 | 2,446 | 2,106 | 374 | -920 | -2,321 | -2,638 |
| 2012 | -2,148 | -1,240 | 538 | 2,128 | 2,425 | 2,181 | 2,217 | 2,122 | 277 | -1,038 | -1,994 | -2,305 |
| 2013 | -2,031 | -1,274 | 54 | 1,769 | 2,138 | 2,284 | 2,417 | 2,217 | 374 | -1,314 | -2,599 | -2,655 |
| 2014 | -2,057 | -1,444 | 233 | 1,912 | 2,403 | 2,011 | 2,983 | 2,079 | 140 | -1,078 | -2,366 | -3,011 |
| 2015 | -2,471 | -1,757 | 120 | 1,965 | 2,643 | 2,553 | 2,327 | 2,322 | 63 | -1,819 | -3,038 | -2,734 |
| 2016 | -2,958 | -1,602 | 69 | 1,806 | 2,437 | 2,620 | 2,566 | 2,372 | -12 | -1,402 | -2,503 | -3,032 |
| 2017 | -2,616 | -1,371 | -47 | 1,792 | 2,249 | 2,434 | 2,353 | 2,103 | -689 | -1,137 | -3,398 | -3,326 |
| 2018 | -2,593 | -2,073 | -300 | 1,758 | 2,584 | 2,156 | 2,010 | 1,899 | -171 | -2,278 | -2,955 | -3,160 |
| 2019 | -2,818 | -1,777 | -273 | 1,809 | 2,486 | 2,440 | 2,556 | 2,292 | 339 | -1,712 | -3,218 | -2,505 |
| 2020 | -2,548 | -1,598 | 19 | 1,851 | 1,943 | 1,859 | 1,786 | 1,857 | 207 | -1,949 | -2,938 | -2,782 |
| 2021 | -2,514 | -1,386 | -14 | 1,709 | 2,597 | 2,346 | 2,266 | 1,982 | 13 | -1,815 | -2,867 | -2,947 |
| 2022 | -2,340 | -1,464 | -41 | 1,829 | 2,592 | 2,379 | 2,389 | 1,991 | 207 | -1,453 | -2,366 | -2,253 |
| 2023 | -2,128 | -1,770 | -51 | 1,969 | 2,218 | 3,040 | 2,491 | 2,441 | 206 | -1,948 | -2,689 | -3,253 |
| 2024 | -2,400 | |||||||||||
| - = No Data Reported; -- = Not Applicable; NA = Not Available; W = Withheld to avoid disclosure of individual company data. |
| Release Date: 3/29/2024 |
| Next Release Date: 4/30/2024 |