|
Download Data (XLS File) |
|
||||||||
|
||||||||
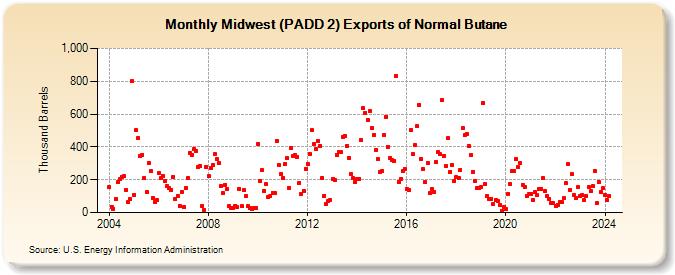
| Midwest (PADD 2) Exports of Normal Butane (Thousand Barrels) | ||||||||
| Year | Jan | Feb | Mar | Apr | May | Jun | Jul | Aug | Sep | Oct | Nov | Dec |
|---|---|---|---|---|---|---|---|---|---|---|---|---|
| 2004 | 154 | 36 | 24 | 82 | 186 | 202 | 219 | 220 | 139 | 62 | 80 | 801 |
| 2005 | 107 | 502 | 455 | 342 | 353 | 209 | 126 | 304 | 251 | 91 | 66 | 76 |
| 2006 | 238 | 208 | 224 | 193 | 159 | 148 | 139 | 218 | 81 | 102 | 42 | 128 |
| 2007 | 32 | 151 | 209 | 363 | 350 | 385 | 376 | 277 | 286 | 41 | 16 | 278 |
| 2008 | 222 | 274 | 290 | 355 | 326 | 301 | 160 | 118 | 170 | 144 | 38 | 29 |
| 2009 | 28 | 43 | 32 | 146 | 38 | 137 | 98 | 38 | 25 | 19 | 30 | 28 |
| 2010 | 420 | 191 | 257 | 134 | 172 | 92 | 103 | 121 | 122 | 438 | 289 | 234 |
| 2011 | 209 | 295 | 332 | 152 | 396 | 342 | 352 | 339 | 183 | 115 | 133 | 267 |
| 2012 | 297 | 358 | 501 | 418 | 388 | 437 | 407 | 212 | 103 | 54 | 71 | 76 |
| 2013 | 206 | 197 | 353 | 369 | 367 | 461 | 468 | 406 | 331 | 234 | 209 | 188 |
| 2014 | 204 | 206 | 439 | 636 | 608 | 566 | 616 | 517 | 474 | 384 | 325 | 246 |
| 2015 | 253 | 470 | 584 | 402 | 333 | 320 | 315 | 830 | 185 | 206 | 252 | 264 |
| 2016 | 143 | 136 | 501 | 355 | 413 | 525 | 658 | 329 | 265 | 186 | 302 | 117 |
| 2017 | 145 | 126 | 310 | 368 | 356 | 685 | 345 | 285 | 453 | 249 | 290 | 194 |
| 2018 | 217 | 208 | 260 | 514 | 470 | 479 | 406 | 351 | 249 | 194 | 149 | 147 |
| 2019 | 158 | 668 | 171 | 101 | 85 | 85 | 52 | 75 | 71 | 45 | 12 | 32 |
| 2020 | 19 | 116 | 172 | 255 | 256 | 324 | 277 | 300 | 170 | 153 | 100 | 111 |
| 2021 | 116 | 76 | 125 | 105 | 142 | 146 | 210 | 129 | 98 | 80 | 57 | 56 |
| 2022 | 43 | 47 | 64 | 62 | 86 | 178 | 294 | 139 | 232 | 106 | 89 | 154 |
| 2023 | 101 | 106 | 74 | 100 | 157 | 129 | 160 | 256 | 58 | 185 | 124 | 148 |
| 2024 | 110 | 76 | ||||||||||
| - = No Data Reported; -- = Not Applicable; NA = Not Available; W = Withheld to avoid disclosure of individual company data. |
| Release Date: 4/30/2024 |
| Next Release Date: 5/31/2024 |