|
Download Data (XLS File) |
|
||||||||
|
||||||||
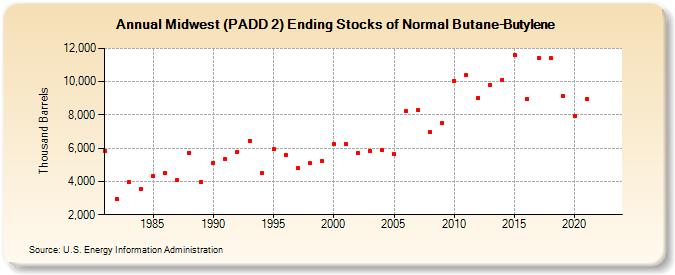
| Midwest (PADD 2) Ending Stocks of Normal Butane-Butylene (Thousand Barrels) | ||||||||
| Decade | Year-0 | Year-1 | Year-2 | Year-3 | Year-4 | Year-5 | Year-6 | Year-7 | Year-8 | Year-9 |
|---|---|---|---|---|---|---|---|---|---|---|
| 1980's | 5,805 | 2,952 | 3,966 | 3,561 | 4,331 | 4,494 | 4,090 | 5,740 | 3,995 | |
| 1990's | 5,121 | 5,334 | 5,774 | 6,432 | 4,480 | 5,935 | 5,581 | 4,802 | 5,085 | 5,210 |
| 2000's | 6,260 | 6,269 | 5,697 | 5,815 | 5,912 | 5,636 | 8,229 | 8,295 | 6,959 | 7,541 |
| 2010's | 10,065 | 10,398 | 9,044 | 9,801 | 10,115 | 11,605 | 8,942 | 11,428 | 11,396 | 9,163 |
| 2020's | 7,962 | 8,960 | -- | -- |
| - = No Data Reported; -- = Not Applicable; NA = Not Available; W = Withheld to avoid disclosure of individual company data. |
| Release Date: 3/29/2024 |
| Next Release Date: 8/30/2024 |