|
Download Data (XLS File) |
|
||||||||
|
||||||||
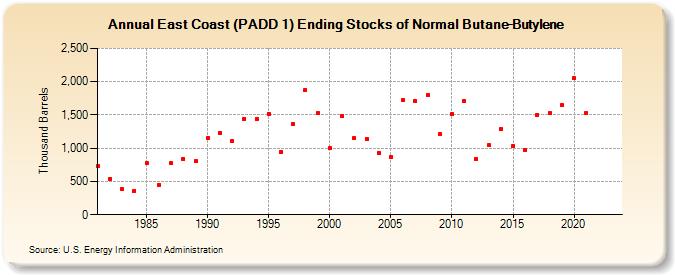
| East Coast (PADD 1) Ending Stocks of Normal Butane-Butylene (Thousand Barrels) | ||||||||
| Decade | Year-0 | Year-1 | Year-2 | Year-3 | Year-4 | Year-5 | Year-6 | Year-7 | Year-8 | Year-9 |
|---|---|---|---|---|---|---|---|---|---|---|
| 1980's | 727 | 539 | 384 | 362 | 771 | 452 | 777 | 840 | 805 | |
| 1990's | 1,160 | 1,233 | 1,102 | 1,444 | 1,446 | 1,521 | 947 | 1,369 | 1,871 | 1,526 |
| 2000's | 996 | 1,477 | 1,149 | 1,141 | 924 | 866 | 1,722 | 1,708 | 1,798 | 1,209 |
| 2010's | 1,519 | 1,703 | 837 | 1,043 | 1,291 | 1,040 | 972 | 1,504 | 1,527 | 1,642 |
| 2020's | 2,048 | 1,527 | -- | -- |
| - = No Data Reported; -- = Not Applicable; NA = Not Available; W = Withheld to avoid disclosure of individual company data. |
| Release Date: 3/29/2024 |
| Next Release Date: 8/30/2024 |