|
Download Data (XLS File) |
|
||||||||
|
||||||||
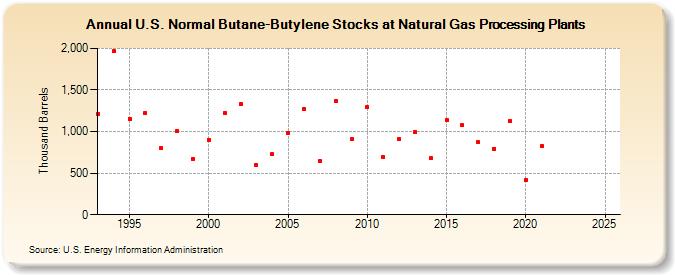
| U.S. Normal Butane-Butylene Stocks at Natural Gas Processing Plants (Thousand Barrels) | ||||||||
| Decade | Year-0 | Year-1 | Year-2 | Year-3 | Year-4 | Year-5 | Year-6 | Year-7 | Year-8 | Year-9 |
|---|---|---|---|---|---|---|---|---|---|---|
| 1990's | 1,216 | 1,967 | 1,155 | 1,223 | 799 | 1,002 | 673 | |||
| 2000's | 904 | 1,226 | 1,330 | 597 | 730 | 988 | 1,269 | 646 | 1,373 | 907 |
| 2010's | 1,292 | 688 | 907 | 992 | 678 | 1,134 | 1,075 | 871 | 795 | 1,129 |
| 2020's | 416 | 824 | -- | -- |
| - = No Data Reported; -- = Not Applicable; NA = Not Available; W = Withheld to avoid disclosure of individual company data. |
| Release Date: 3/29/2024 |
| Next Release Date: 8/30/2024 |