|
Download Data (XLS File) |
|
||||||||
|
||||||||
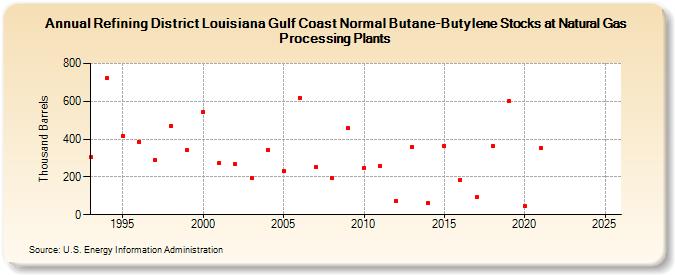
| Refining District Louisiana Gulf Coast Normal Butane-Butylene Stocks at Natural Gas Processing Plants (Thousand Barrels) | ||||||||
| Decade | Year-0 | Year-1 | Year-2 | Year-3 | Year-4 | Year-5 | Year-6 | Year-7 | Year-8 | Year-9 |
|---|---|---|---|---|---|---|---|---|---|---|
| 1990's | 303 | 721 | 419 | 386 | 290 | 468 | 340 | |||
| 2000's | 544 | 276 | 266 | 192 | 344 | 231 | 618 | 250 | 194 | 458 |
| 2010's | 248 | 258 | 75 | 360 | 63 | 365 | 186 | 92 | 364 | 601 |
| 2020's | 45 | 353 | -- | -- |
| - = No Data Reported; -- = Not Applicable; NA = Not Available; W = Withheld to avoid disclosure of individual company data. |
| Release Date: 3/29/2024 |
| Next Release Date: 8/30/2024 |