|
Download Data (XLS File) |
|
||||||||
|
||||||||
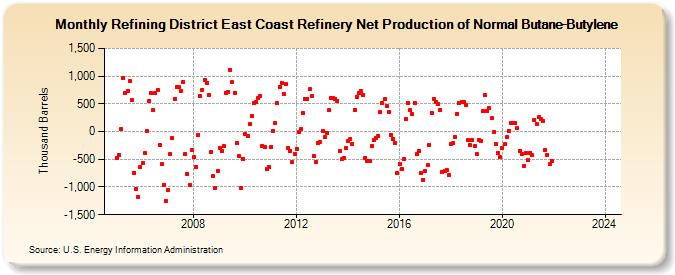
| Refining District East Coast Refinery Net Production of Normal Butane-Butylene (Thousand Barrels) | ||||||||
| Year | Jan | Feb | Mar | Apr | May | Jun | Jul | Aug | Sep | Oct | Nov | Dec |
|---|---|---|---|---|---|---|---|---|---|---|---|---|
| 2005 | -477 | -414 | 42 | 960 | 695 | 732 | 904 | 575 | -739 | -1,034 | -1,173 | -645 |
| 2006 | -567 | -388 | 5 | 547 | 692 | 384 | 688 | 747 | -242 | -591 | -959 | -1,247 |
| 2007 | -1,047 | -402 | -121 | 595 | 805 | 808 | 737 | 898 | -406 | -767 | -968 | -329 |
| 2008 | -466 | -638 | -56 | 640 | 756 | 925 | 877 | 664 | -362 | -810 | -1,018 | -710 |
| 2009 | -291 | -350 | -262 | 692 | 722 | 1,118 | 890 | 702 | -201 | -433 | -1,011 | -491 |
| 2010 | -45 | -86 | 135 | 285 | 510 | 532 | 603 | 635 | -260 | -274 | -675 | -633 |
| 2011 | -277 | 12 | 161 | 512 | 804 | 884 | 681 | 855 | -290 | -344 | -555 | -409 |
| 2012 | -306 | -16 | 43 | 334 | 594 | 594 | 762 | 642 | -443 | -543 | -210 | -183 |
| 2013 | 2 | -90 | -20 | 382 | 612 | 603 | 584 | 549 | -349 | -503 | -472 | -301 |
| 2014 | -175 | -129 | -232 | 394 | 632 | 694 | 732 | 663 | -470 | -532 | -534 | -260 |
| 2015 | -149 | -117 | -87 | 351 | 513 | 580 | 454 | 349 | -60 | -130 | -209 | -747 |
| 2016 | -581 | -667 | -501 | 235 | 520 | 395 | 319 | 524 | -406 | -345 | -748 | -869 |
| 2017 | -705 | -612 | -245 | 341 | 594 | 540 | 496 | 396 | -725 | -712 | -692 | -789 |
| 2018 | -229 | -213 | -92 | 322 | 515 | 529 | 531 | 480 | -157 | -244 | -155 | -264 |
| 2019 | -401 | -150 | -168 | 370 | 655 | 364 | 419 | 237 | -11 | -229 | -386 | -466 |
| 2020 | -290 | -229 | -101 | 17 | 163 | 146 | 147 | 70 | -347 | -403 | -618 | -385 |
| 2021 | -516 | -379 | -431 | 211 | 140 | 254 | 226 | 191 | -337 | -427 | -593 | -527 |
| 2022 | -- | -- | -- | -- | -- | -- | -- | -- | -- | -- | -- | -- |
| 2023 | -- | -- | -- | -- | -- | -- | -- | -- | -- | -- | -- | -- |
| 2024 | -- | |||||||||||
| - = No Data Reported; -- = Not Applicable; NA = Not Available; W = Withheld to avoid disclosure of individual company data. |
| Release Date: 3/29/2024 |
| Next Release Date: 4/30/2024 |