|
Download Data (XLS File) |
|
||||||||
|
||||||||
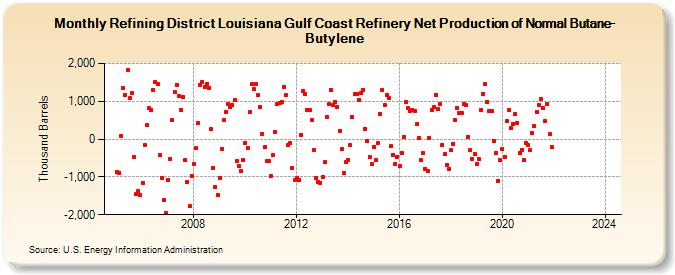
| Refining District Louisiana Gulf Coast Refinery Net Production of Normal Butane-Butylene (Thousand Barrels) | ||||||||
| Year | Jan | Feb | Mar | Apr | May | Jun | Jul | Aug | Sep | Oct | Nov | Dec |
|---|---|---|---|---|---|---|---|---|---|---|---|---|
| 2005 | -859 | -887 | 82 | 1,359 | 1,167 | 1,829 | 1,077 | 1,211 | -467 | -1,462 | -1,381 | -1,483 |
| 2006 | -1,155 | -151 | 363 | 811 | 773 | 1,302 | 1,501 | 1,464 | -426 | -1,019 | -1,612 | -1,962 |
| 2007 | -1,083 | -514 | 494 | 1,238 | 1,434 | 1,139 | 775 | 1,126 | -565 | -1,133 | -1,765 | -967 |
| 2008 | -665 | -233 | 429 | 1,429 | 1,522 | 1,378 | 1,451 | 1,359 | 271 | -754 | -1,258 | -1,478 |
| 2009 | -1,019 | -258 | 493 | 729 | 938 | 844 | 914 | 1,035 | -583 | -715 | -846 | -561 |
| 2010 | -106 | -231 | 706 | 1,448 | 1,317 | 1,449 | 1,161 | 851 | 147 | -217 | -592 | -585 |
| 2011 | -989 | -430 | 198 | 934 | 942 | 990 | 1,372 | 1,158 | -169 | -110 | -768 | -1,095 |
| 2012 | -1,042 | -1,075 | 119 | 1,277 | 1,196 | 776 | 782 | 510 | -277 | -1,033 | -1,134 | -1,151 |
| 2013 | -998 | -618 | 577 | 918 | 1,309 | 914 | 984 | 854 | 222 | -250 | -906 | -613 |
| 2014 | -554 | -168 | 584 | 1,183 | 1,182 | 1,046 | 1,226 | 1,307 | 277 | -63 | -470 | -656 |
| 2015 | -201 | -565 | -110 | 659 | 1,296 | 902 | 1,178 | 1,081 | -195 | -414 | -651 | -463 |
| 2016 | -724 | -373 | 64 | 985 | 814 | 741 | 764 | 750 | 389 | 30 | -562 | -363 |
| 2017 | -797 | -847 | 24 | 767 | 836 | 1,164 | 790 | 920 | -144 | -394 | -686 | -804 |
| 2018 | -296 | -132 | 514 | 832 | 697 | 699 | 939 | 904 | 65 | -298 | -521 | -386 |
| 2019 | -666 | -536 | 773 | 1,192 | 1,470 | 988 | 745 | 737 | -44 | -366 | -1,100 | -548 |
| 2020 | -271 | -480 | 478 | 757 | 285 | 409 | 662 | 427 | -364 | -276 | -551 | -102 |
| 2021 | -152 | -300 | 166 | 349 | 725 | 889 | 1,048 | 814 | 472 | 926 | 130 | -212 |
| 2022 | -- | -- | -- | -- | -- | -- | -- | -- | -- | -- | -- | -- |
| 2023 | -- | -- | -- | -- | -- | -- | -- | -- | -- | -- | -- | -- |
| 2024 | -- | |||||||||||
| - = No Data Reported; -- = Not Applicable; NA = Not Available; W = Withheld to avoid disclosure of individual company data. |
| Release Date: 3/29/2024 |
| Next Release Date: 4/30/2024 |