|
Download Data (XLS File) |
|
||||||||
|
||||||||
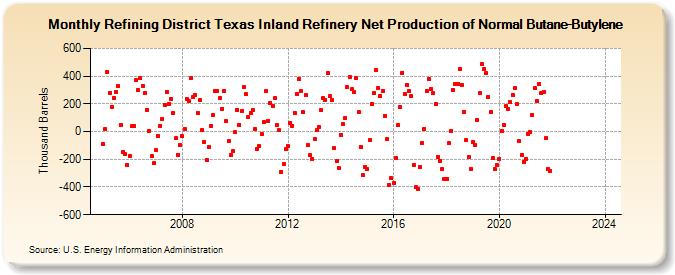
| Refining District Texas Inland Refinery Net Production of Normal Butane-Butylene (Thousand Barrels) | ||||||||
| Year | Jan | Feb | Mar | Apr | May | Jun | Jul | Aug | Sep | Oct | Nov | Dec |
|---|---|---|---|---|---|---|---|---|---|---|---|---|
| 2005 | -90 | 17 | 432 | 280 | 179 | 245 | 285 | 329 | 49 | -145 | -162 | -240 |
| 2006 | -175 | 38 | 39 | 370 | 301 | 384 | 329 | 276 | 157 | 7 | -177 | -228 |
| 2007 | -135 | -33 | 43 | 94 | 195 | 287 | 199 | 238 | 136 | -49 | -166 | -94 |
| 2008 | -34 | 22 | 235 | 221 | 384 | 246 | 265 | 135 | 228 | 11 | -74 | -203 |
| 2009 | -110 | 40 | 121 | 290 | 293 | 240 | 165 | 290 | 73 | -69 | -168 | -143 |
| 2010 | -6 | 157 | 48 | 149 | 321 | 268 | 103 | 134 | 156 | 17 | -126 | -107 |
| 2011 | -19 | 68 | 292 | 78 | 204 | 186 | 240 | 44 | 9 | -291 | -236 | -128 |
| 2012 | -107 | 61 | 43 | 135 | 268 | 377 | 289 | 138 | 262 | -96 | -170 | -198 |
| 2013 | -51 | 9 | 33 | 152 | 240 | 228 | 424 | 255 | 229 | -122 | -215 | -260 |
| 2014 | -23 | 52 | 98 | 318 | 396 | 304 | 286 | 383 | 139 | -115 | -317 | -254 |
| 2015 | -271 | -62 | 197 | 275 | 441 | 316 | 253 | 289 | 113 | -54 | -387 | -337 |
| 2016 | -370 | -188 | 46 | 175 | 425 | 273 | 338 | 293 | 257 | -241 | -403 | -415 |
| 2017 | -257 | -84 | 21 | 292 | 378 | 307 | 278 | 200 | -181 | -209 | -273 | -339 |
| 2018 | -341 | -85 | 7 | 302 | 343 | 341 | 451 | 339 | 144 | -62 | -183 | -270 |
| 2019 | -75 | -96 | 82 | 275 | 487 | 453 | 419 | 252 | 139 | -193 | -273 | -239 |
| 2020 | -197 | 4 | 50 | 182 | 163 | 210 | 267 | 313 | 201 | -70 | -167 | -218 |
| 2021 | -196 | -18 | -4 | 123 | 311 | 220 | 343 | 277 | 287 | -50 | -271 | -282 |
| 2022 | -- | -- | -- | -- | -- | -- | -- | -- | -- | -- | -- | -- |
| 2023 | -- | -- | -- | -- | -- | -- | -- | -- | -- | -- | -- | -- |
| 2024 | -- | |||||||||||
| - = No Data Reported; -- = Not Applicable; NA = Not Available; W = Withheld to avoid disclosure of individual company data. |
| Release Date: 3/29/2024 |
| Next Release Date: 4/30/2024 |