|
Download Data (XLS File) |
|
||||||||
|
||||||||
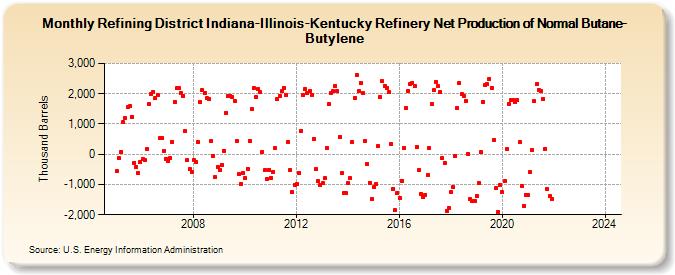
| Refining District Indiana-Illinois-Kentucky Refinery Net Production of Normal Butane-Butylene (Thousand Barrels) | ||||||||
| Year | Jan | Feb | Mar | Apr | May | Jun | Jul | Aug | Sep | Oct | Nov | Dec |
|---|---|---|---|---|---|---|---|---|---|---|---|---|
| 2005 | -558 | -133 | 87 | 1,054 | 1,183 | 1,550 | 1,585 | 1,245 | -277 | -439 | -616 | -253 |
| 2006 | -171 | -175 | 179 | 1,655 | 1,994 | 2,065 | 1,855 | 1,965 | 536 | 539 | 116 | -147 |
| 2007 | -209 | -133 | 417 | 1,742 | 2,175 | 2,181 | 2,025 | 1,937 | 759 | -198 | -491 | -595 |
| 2008 | -191 | -251 | 396 | 1,721 | 2,115 | 2,018 | 1,846 | 1,825 | 434 | -48 | -757 | -419 |
| 2009 | -537 | -341 | 123 | 1,379 | 1,922 | 1,934 | 1,899 | 1,762 | 441 | -662 | -969 | -616 |
| 2010 | -783 | -475 | 430 | 1,497 | 2,194 | 1,884 | 2,148 | 2,049 | 77 | -538 | -811 | -510 |
| 2011 | -776 | -583 | 192 | 1,839 | 1,931 | 2,075 | 2,203 | 1,966 | 419 | -520 | -1,265 | -1,003 |
| 2012 | -975 | -611 | 781 | 1,949 | 2,162 | 2,027 | 2,075 | 1,966 | 515 | -482 | -900 | -1,029 |
| 2013 | -958 | -795 | 206 | 1,655 | 2,034 | 2,087 | 2,256 | 2,074 | 581 | -632 | -1,281 | -1,297 |
| 2014 | -950 | -798 | 388 | 1,854 | 2,628 | 2,078 | 2,366 | 2,024 | 445 | -325 | -941 | -1,473 |
| 2015 | -1,096 | -999 | 265 | 1,895 | 2,415 | 2,269 | 2,173 | 2,045 | 341 | -1,148 | -1,845 | -1,268 |
| 2016 | -1,450 | -870 | 193 | 1,529 | 2,097 | 2,336 | 2,364 | 2,268 | 246 | -530 | -1,307 | -1,415 |
| 2017 | -1,337 | -693 | 211 | 1,660 | 2,113 | 2,396 | 2,239 | 2,055 | -123 | -279 | -1,869 | -1,772 |
| 2018 | -1,251 | -1,084 | -60 | 1,525 | 2,360 | 1,980 | 1,932 | 1,769 | 23 | -1,494 | -1,540 | -1,545 |
| 2019 | -1,367 | -937 | 72 | 1,733 | 2,285 | 2,309 | 2,497 | 2,200 | 482 | -1,131 | -1,896 | -1,019 |
| 2020 | -1,261 | -899 | 164 | 1,661 | 1,786 | 1,792 | 1,711 | 1,779 | 394 | -1,039 | -1,705 | -1,347 |
| 2021 | -1,362 | -597 | 134 | 1,748 | 2,313 | 2,129 | 2,103 | 1,829 | 177 | -1,143 | -1,395 | -1,495 |
| 2022 | -- | -- | -- | -- | -- | -- | -- | -- | -- | -- | -- | -- |
| 2023 | -- | -- | -- | -- | -- | -- | -- | -- | -- | -- | -- | -- |
| 2024 | -- | -- | -- | -- | -- | -- | ||||||
| - = No Data Reported; -- = Not Applicable; NA = Not Available; W = Withheld to avoid disclosure of individual company data. |
| Release Date: 8/30/2024 |
| Next Release Date: 9/30/2024 |