|
Download Data (XLS File) |
|
||||||||
|
||||||||
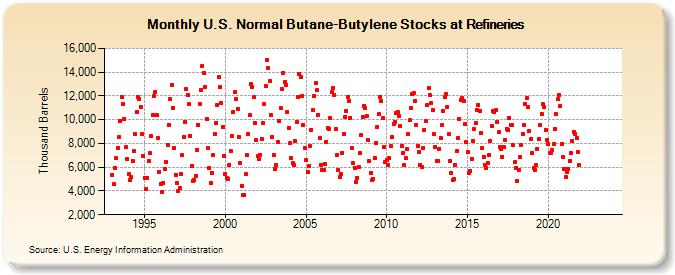
| U.S. Normal Butane-Butylene Stocks at Refineries (Thousand Barrels) | ||||||||
| Year | Jan | Feb | Mar | Apr | May | Jun | Jul | Aug | Sep | Oct | Nov | Dec |
|---|---|---|---|---|---|---|---|---|---|---|---|---|
| 1993 | 5,374 | 4,555 | 5,940 | 6,740 | 7,634 | 8,510 | 9,859 | 11,928 | 11,335 | 10,089 | 7,716 | 6,731 |
| 1994 | 5,419 | 4,933 | 5,137 | 6,527 | 7,329 | 8,826 | 10,629 | 11,930 | 11,770 | 11,073 | 8,768 | 6,940 |
| 1995 | 5,107 | 4,128 | 5,109 | 6,521 | 7,177 | 8,617 | 10,411 | 11,963 | 12,322 | 10,398 | 8,494 | 5,631 |
| 1996 | 4,557 | 3,935 | 4,696 | 5,830 | 6,476 | 7,885 | 9,586 | 11,777 | 12,951 | 10,996 | 7,629 | 5,384 |
| 1997 | 4,638 | 4,011 | 4,263 | 5,424 | 7,020 | 8,572 | 9,844 | 12,589 | 12,070 | 11,282 | 8,617 | 6,136 |
| 1998 | 4,808 | 4,882 | 5,254 | 7,436 | 9,580 | 11,356 | 12,539 | 14,553 | 13,967 | 12,787 | 10,069 | 7,575 |
| 1999 | 5,949 | 4,685 | 5,547 | 7,008 | 8,785 | 9,742 | 11,269 | 13,550 | 12,719 | 11,421 | 9,362 | 6,917 |
| 2000 | 5,464 | 5,073 | 5,046 | 6,208 | 7,357 | 8,655 | 10,671 | 12,334 | 11,753 | 10,900 | 8,572 | 6,344 |
| 2001 | 4,443 | 3,663 | 3,699 | 5,399 | 7,015 | 8,805 | 10,391 | 12,961 | 12,779 | 11,883 | 9,718 | 8,260 |
| 2002 | 6,943 | 6,650 | 7,060 | 8,359 | 9,694 | 11,284 | 12,844 | 15,039 | 14,382 | 13,265 | 10,376 | 8,580 |
| 2003 | 7,051 | 5,864 | 6,188 | 8,103 | 9,874 | 10,973 | 12,588 | 13,960 | 13,187 | 12,941 | 10,646 | 9,323 |
| 2004 | 8,021 | 6,737 | 6,355 | 6,173 | 8,169 | 9,800 | 11,950 | 13,884 | 13,578 | 12,026 | 9,544 | 7,578 |
| 2005 | 6,610 | 5,625 | 6,085 | 7,820 | 9,168 | 10,802 | 11,951 | 13,081 | 12,492 | 10,428 | 8,434 | 6,219 |
| 2006 | 5,726 | 5,785 | 6,241 | 8,123 | 9,296 | 9,248 | 10,171 | 12,296 | 12,673 | 12,080 | 9,222 | 7,014 |
| 2007 | 5,755 | 5,193 | 5,433 | 7,221 | 8,833 | 10,267 | 10,720 | 11,944 | 11,530 | 10,181 | 7,586 | 6,320 |
| 2008 | 5,959 | 4,752 | 5,123 | 6,000 | 7,235 | 8,716 | 10,259 | 11,133 | 10,996 | 10,280 | 8,256 | 6,482 |
| 2009 | 5,520 | 4,963 | 5,023 | 6,761 | 8,038 | 9,405 | 10,477 | 11,915 | 11,583 | 10,124 | 7,675 | 6,478 |
| 2010 | 6,611 | 6,146 | 6,765 | 7,744 | 8,505 | 9,600 | 9,805 | 10,568 | 10,631 | 10,307 | 9,446 | 7,818 |
| 2011 | 7,221 | 6,162 | 6,735 | 7,531 | 8,788 | 9,937 | 10,993 | 12,155 | 12,248 | 11,577 | 9,562 | 7,794 |
| 2012 | 7,282 | 6,169 | 6,019 | 7,655 | 9,147 | 9,857 | 11,218 | 12,646 | 12,044 | 11,414 | 10,806 | 8,774 |
| 2013 | 7,739 | 6,533 | 6,547 | 7,565 | 8,432 | 9,511 | 10,748 | 11,921 | 12,147 | 11,075 | 8,763 | 6,529 |
| 2014 | 5,525 | 4,932 | 5,013 | 6,222 | 7,352 | 8,458 | 10,078 | 11,677 | 11,800 | 11,599 | 9,629 | 8,110 |
| 2015 | 7,238 | 5,519 | 5,676 | 6,699 | 8,234 | 9,216 | 9,736 | 10,856 | 11,216 | 10,744 | 8,838 | 7,644 |
| 2016 | 6,898 | 6,154 | 5,946 | 6,378 | 7,052 | 8,237 | 9,498 | 10,710 | 10,666 | 10,792 | 9,797 | 8,928 |
| 2017 | 7,671 | 7,536 | 6,888 | 7,728 | 8,261 | 9,253 | 9,163 | 10,180 | 9,576 | 9,578 | 7,860 | 6,423 |
| 2018 | 5,929 | 4,874 | 5,792 | 6,874 | 7,907 | 8,812 | 9,570 | 11,329 | 11,805 | 11,036 | 9,068 | 8,363 |
| 2019 | 7,197 | 5,953 | 5,783 | 6,161 | 7,530 | 8,350 | 9,559 | 10,517 | 11,288 | 11,061 | 9,146 | 8,281 |
| 2020 | 7,924 | 7,222 | 7,173 | 7,487 | 7,963 | 9,241 | 10,471 | 11,713 | 12,049 | 11,152 | 7,980 | 6,845 |
| 2021 | 5,845 | 5,194 | 5,586 | 5,834 | 6,534 | 7,198 | 8,187 | 8,966 | 8,803 | 8,448 | 7,281 | 6,200 |
| 2022 | -- | -- | -- | -- | -- | -- | -- | -- | -- | -- | -- | -- |
| 2023 | -- | -- | -- | -- | -- | -- | -- | -- | -- | -- | -- | -- |
| 2024 | -- | |||||||||||
| - = No Data Reported; -- = Not Applicable; NA = Not Available; W = Withheld to avoid disclosure of individual company data. |
| Release Date: 3/29/2024 |
| Next Release Date: 4/30/2024 |