|
Download Data (XLS File) |
|
||||||||
|
||||||||
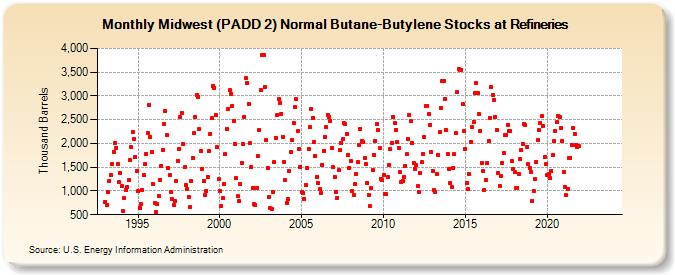
| Midwest (PADD 2) Normal Butane-Butylene Stocks at Refineries (Thousand Barrels) | ||||||||
| Year | Jan | Feb | Mar | Apr | May | Jun | Jul | Aug | Sep | Oct | Nov | Dec |
|---|---|---|---|---|---|---|---|---|---|---|---|---|
| 1993 | 774 | 695 | 971 | 1,219 | 1,332 | 1,577 | 1,826 | 2,012 | 1,910 | 1,563 | 1,183 | 1,387 |
| 1994 | 1,096 | 571 | 843 | 1,022 | 1,092 | 1,239 | 1,653 | 1,917 | 2,247 | 2,103 | 1,706 | 1,410 |
| 1995 | 989 | 650 | 728 | 1,019 | 1,341 | 1,558 | 1,788 | 2,224 | 2,808 | 2,139 | 1,820 | 1,154 |
| 1996 | 747 | 567 | 721 | 884 | 1,239 | 1,534 | 1,863 | 2,410 | 2,684 | 2,184 | 1,490 | 1,334 |
| 1997 | 969 | 822 | 698 | 789 | 1,218 | 1,631 | 1,881 | 2,548 | 2,642 | 1,985 | 1,496 | 1,122 |
| 1998 | 1,045 | 881 | 665 | 1,199 | 1,699 | 2,210 | 2,556 | 3,027 | 2,982 | 2,304 | 1,835 | 1,467 |
| 1999 | 1,207 | 919 | 1,006 | 1,303 | 1,833 | 2,207 | 2,526 | 3,219 | 3,173 | 2,603 | 1,920 | 1,244 |
| 2000 | 992 | 681 | 844 | 1,141 | 1,769 | 2,306 | 2,734 | 3,116 | 3,042 | 2,792 | 2,475 | 1,986 |
| 2001 | 1,263 | 892 | 783 | 1,139 | 1,589 | 1,983 | 2,563 | 3,376 | 3,264 | 2,838 | 2,001 | 1,494 |
| 2002 | 1,059 | 715 | 708 | 1,069 | 1,728 | 2,285 | 3,123 | 3,865 | 3,852 | 3,198 | 2,069 | 1,479 |
| 2003 | 879 | 638 | 626 | 982 | 1,603 | 2,120 | 2,595 | 2,939 | 2,861 | 2,625 | 2,140 | 1,617 |
| 2004 | 1,231 | 749 | 828 | 1,430 | 1,818 | 2,062 | 2,432 | 2,762 | 2,932 | 2,253 | 1,890 | 1,497 |
| 2005 | 974 | 947 | 836 | 1,135 | 1,480 | 1,889 | 2,345 | 2,724 | 2,544 | 2,033 | 1,737 | 1,303 |
| 2006 | 1,163 | 1,041 | 950 | 1,554 | 1,846 | 2,134 | 2,343 | 2,605 | 2,557 | 2,478 | 1,902 | 1,495 |
| 2007 | 1,291 | 988 | 852 | 1,433 | 1,854 | 2,004 | 2,090 | 2,425 | 2,402 | 2,195 | 1,759 | 1,490 |
| 2008 | 1,634 | 1,002 | 923 | 1,155 | 1,359 | 1,606 | 1,974 | 2,311 | 2,054 | 2,037 | 1,691 | 1,566 |
| 2009 | 1,168 | 922 | 675 | 1,052 | 1,433 | 1,763 | 2,047 | 2,407 | 2,289 | 1,911 | 1,257 | 1,236 |
| 2010 | 1,327 | 941 | 933 | 1,297 | 1,552 | 1,875 | 2,019 | 2,560 | 2,429 | 2,291 | 2,028 | 1,911 |
| 2011 | 1,401 | 1,180 | 1,199 | 1,298 | 1,534 | 1,772 | 2,103 | 2,597 | 2,463 | 2,013 | 1,589 | 1,472 |
| 2012 | 1,556 | 1,103 | 987 | 1,378 | 1,606 | 1,783 | 2,132 | 2,791 | 2,785 | 2,614 | 2,392 | 1,819 |
| 2013 | 1,412 | 1,025 | 986 | 1,362 | 1,762 | 2,235 | 2,756 | 3,315 | 3,323 | 2,943 | 2,280 | 1,783 |
| 2014 | 1,472 | 1,173 | 1,091 | 1,489 | 1,770 | 2,221 | 3,073 | 3,576 | 3,540 | 3,554 | 2,827 | 2,261 |
| 2015 | 1,889 | 1,176 | 1,044 | 1,353 | 2,033 | 2,336 | 2,461 | 3,055 | 3,278 | 3,056 | 2,615 | 2,263 |
| 2016 | 1,594 | 1,414 | 1,023 | 1,236 | 1,579 | 2,041 | 2,543 | 3,183 | 3,028 | 2,924 | 2,555 | 2,293 |
| 2017 | 1,376 | 1,106 | 1,305 | 1,593 | 1,798 | 2,186 | 2,179 | 2,398 | 2,267 | 2,272 | 1,633 | 1,459 |
| 2018 | 1,397 | 1,062 | 1,069 | 1,356 | 1,673 | 1,870 | 1,997 | 2,411 | 2,387 | 1,924 | 1,572 | 1,492 |
| 2019 | 1,400 | 791 | 1,000 | 1,243 | 1,616 | 2,070 | 2,292 | 2,427 | 2,571 | 2,371 | 1,710 | 1,564 |
| 2020 | 1,333 | 1,353 | 1,283 | 1,421 | 1,752 | 2,044 | 2,271 | 2,443 | 2,567 | 2,552 | 2,332 | 2,052 |
| 2021 | 1,394 | 1,076 | 913 | 1,043 | 1,688 | 1,694 | 1,973 | 2,320 | 2,209 | 1,961 | 1,919 | 1,936 |
| 2022 | -- | -- | -- | -- | -- | -- | -- | -- | -- | -- | -- | -- |
| 2023 | -- | -- | -- | -- | -- | -- | -- | -- | -- | -- | -- | -- |
| 2024 | -- | -- | ||||||||||
| - = No Data Reported; -- = Not Applicable; NA = Not Available; W = Withheld to avoid disclosure of individual company data. |
| Release Date: 4/30/2024 |
| Next Release Date: 5/31/2024 |