|
Download Data (XLS File) |
|
||||||||
|
||||||||
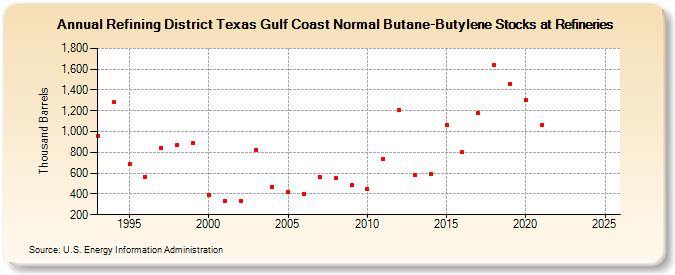
| Refining District Texas Gulf Coast Normal Butane-Butylene Stocks at Refineries (Thousand Barrels) | ||||||||
| Decade | Year-0 | Year-1 | Year-2 | Year-3 | Year-4 | Year-5 | Year-6 | Year-7 | Year-8 | Year-9 |
|---|---|---|---|---|---|---|---|---|---|---|
| 1990's | 955 | 1,280 | 687 | 566 | 845 | 875 | 890 | |||
| 2000's | 391 | 330 | 334 | 823 | 465 | 419 | 400 | 566 | 553 | 483 |
| 2010's | 449 | 739 | 1,206 | 580 | 592 | 1,067 | 799 | 1,181 | 1,643 | 1,454 |
| 2020's | 1,303 | 1,062 | -- | -- |
| - = No Data Reported; -- = Not Applicable; NA = Not Available; W = Withheld to avoid disclosure of individual company data. |
| Release Date: 3/29/2024 |
| Next Release Date: 8/30/2024 |