|
Download Data (XLS File) |
|
||||||||
|
||||||||
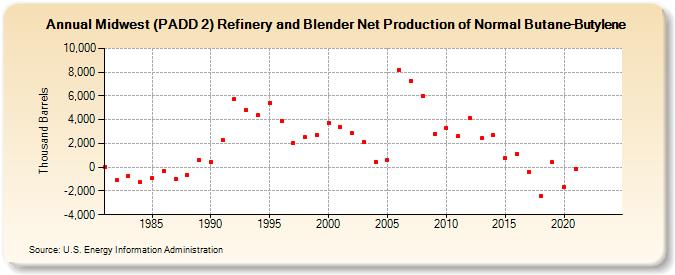
| Midwest (PADD 2) Refinery and Blender Net Production of Normal Butane-Butylene (Thousand Barrels) | ||||||||
| Decade | Year-0 | Year-1 | Year-2 | Year-3 | Year-4 | Year-5 | Year-6 | Year-7 | Year-8 | Year-9 |
|---|---|---|---|---|---|---|---|---|---|---|
| 1980's | 25 | -1,101 | -732 | -1,282 | -897 | -303 | -1,022 | -618 | 623 | |
| 1990's | 433 | 2,321 | 5,733 | 4,823 | 4,370 | 5,413 | 3,930 | 2,042 | 2,512 | 2,743 |
| 2000's | 3,724 | 3,349 | 2,867 | 2,094 | 471 | 618 | 8,197 | 7,282 | 5,984 | 2,800 |
| 2010's | 3,281 | 2,593 | 4,181 | 2,431 | 2,711 | 802 | 1,118 | -397 | -2,425 | 404 |
| 2020's | -1,683 | -172 | -- | -- |
| - = No Data Reported; -- = Not Applicable; NA = Not Available; W = Withheld to avoid disclosure of individual company data. |
| Release Date: 8/30/2024 |
| Next Release Date: 8/29/2025 |