|
Download Data (XLS File) |
|
||||||||
|
||||||||
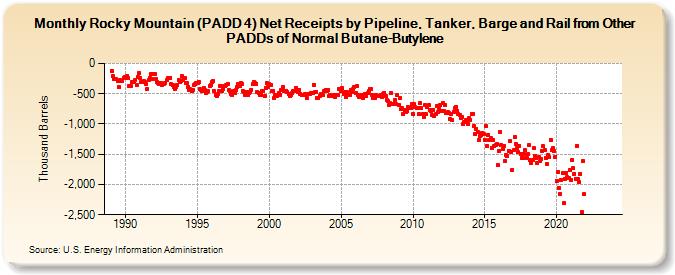
| Rocky Mountain (PADD 4) Net Receipts by Pipeline, Tanker, Barge and Rail from Other PADDs of Normal Butane-Butylene (Thousand Barrels) | ||||||||
| Year | Jan | Feb | Mar | Apr | May | Jun | Jul | Aug | Sep | Oct | Nov | Dec |
|---|---|---|---|---|---|---|---|---|---|---|---|---|
| 1989 | -119 | -203 | -256 | -257 | -263 | -288 | -384 | -276 | -287 | -284 | -239 | -222 |
| 1990 | -226 | -200 | -240 | -376 | -376 | -304 | -301 | -299 | -267 | -360 | -225 | -165 |
| 1991 | -235 | -303 | -306 | -294 | -310 | -342 | -419 | -277 | -234 | -176 | -259 | -180 |
| 1992 | -176 | -256 | -303 | -320 | -339 | -321 | -358 | -347 | -337 | -321 | -281 | -244 |
| 1993 | -235 | -239 | -344 | -357 | -392 | -416 | -388 | -353 | -275 | -309 | -287 | -207 |
| 1994 | -280 | -245 | -317 | -329 | -385 | -436 | -427 | -451 | -437 | -358 | -340 | -327 |
| 1995 | -323 | -308 | -419 | -434 | -454 | -401 | -443 | -481 | -478 | -463 | -366 | -357 |
| 1996 | -307 | -292 | -462 | -519 | -533 | -501 | -447 | -368 | -457 | -414 | -374 | -375 |
| 1997 | -351 | -333 | -435 | -455 | -510 | -524 | -459 | -482 | -435 | -394 | -341 | -379 |
| 1998 | -322 | -336 | -463 | -468 | -514 | -478 | -524 | -486 | -464 | -431 | -345 | -303 |
| 1999 | -321 | -332 | -474 | -487 | -515 | -523 | -459 | -454 | -530 | -407 | -324 | -390 |
| 2000 | -343 | -352 | -460 | -461 | -566 | -523 | -537 | -526 | -489 | -516 | -431 | -383 |
| 2001 | -449 | -451 | -448 | -474 | -512 | -530 | -519 | -482 | -457 | -452 | -405 | -458 |
| 2002 | -464 | -438 | -498 | -525 | -524 | -525 | -511 | -575 | -511 | -503 | -497 | -493 |
| 2003 | -487 | -351 | -475 | -467 | -566 | -563 | -531 | -506 | -528 | -523 | -454 | -433 |
| 2004 | -459 | -433 | -536 | -514 | -534 | -533 | -527 | -561 | -520 | -523 | -430 | -417 |
| 2005 | -458 | -411 | -501 | -475 | -546 | -475 | -504 | -516 | -440 | -475 | -426 | -382 |
| 2006 | -489 | -369 | -516 | -560 | -554 | -517 | -568 | -535 | -511 | -543 | -493 | -462 |
| 2007 | -421 | -421 | -526 | -564 | -567 | -519 | -536 | -545 | -537 | -522 | -558 | -505 |
| 2008 | -483 | -536 | -602 | -619 | -685 | -658 | -488 | -671 | -675 | -601 | -676 | -525 |
| 2009 | -681 | -564 | -760 | -742 | -838 | -767 | -807 | -790 | -724 | -733 | -730 | -674 |
| 2010 | -832 | -676 | -724 | -738 | -741 | -841 | -660 | -741 | -837 | -887 | -688 | -842 |
| 2011 | -727 | -684 | -763 | -788 | -850 | -768 | -873 | -827 | -702 | -799 | -745 | -693 |
| 2012 | -786 | -657 | -793 | -688 | -820 | -795 | -814 | -922 | -842 | -939 | -797 | -743 |
| 2013 | -717 | -779 | -828 | -847 | -907 | -881 | -1,002 | -965 | -936 | -958 | -1,003 | -902 |
| 2014 | -935 | -837 | -831 | -1,033 | -1,163 | -1,075 | -1,140 | -1,263 | -1,192 | -1,175 | -1,151 | -1,158 |
| 2015 | -1,262 | -1,034 | -1,366 | -1,180 | -1,260 | -1,230 | -1,393 | -1,258 | -1,368 | -1,343 | -1,328 | -1,675 |
| 2016 | -1,449 | -1,140 | -1,351 | -1,412 | -1,359 | -1,611 | -1,512 | -1,532 | -1,440 | -1,288 | -1,464 | -1,753 |
| 2017 | -1,435 | -1,216 | -1,334 | -1,391 | -1,468 | -1,358 | -1,497 | -1,556 | -1,564 | -1,492 | -1,432 | -1,556 |
| 2018 | -1,504 | -1,351 | -1,602 | -1,649 | -1,593 | -1,402 | -1,523 | -1,570 | -1,638 | -1,552 | -1,613 | -1,578 |
| 2019 | -1,445 | -1,370 | -1,427 | -1,555 | -1,657 | -1,506 | -1,544 | -1,258 | -1,428 | -1,394 | -1,450 | -1,540 |
| 2020 | -1,946 | -1,794 | -2,056 | -2,157 | -1,922 | -1,816 | -2,310 | -1,908 | -1,803 | -1,884 | -1,899 | -1,761 |
| 2021 | -1,924 | -1,590 | -1,735 | -1,820 | -1,903 | -1,360 | -1,906 | -1,960 | -1,820 | -2,458 | -1,618 | -2,160 |
| 2022 | -- | -- | -- | -- | -- | -- | -- | -- | -- | -- | -- | -- |
| 2023 | -- | -- | -- | -- | -- | -- | -- | -- | -- | -- | -- | -- |
| 2024 | -- | |||||||||||
| - = No Data Reported; -- = Not Applicable; NA = Not Available; W = Withheld to avoid disclosure of individual company data. |
| Release Date: 3/29/2024 |
| Next Release Date: 4/30/2024 |
Referring Pages: