|
Download Data (XLS File) |
|
||||||||
|
||||||||
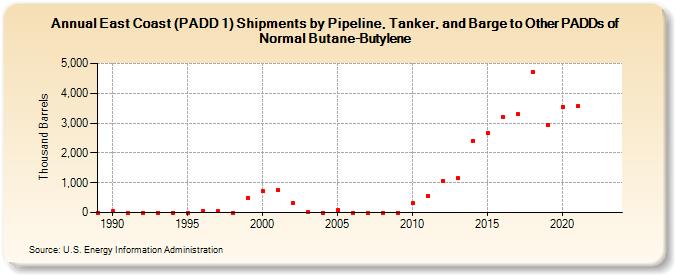
| East Coast (PADD 1) Shipments by Pipeline, Tanker, and Barge to Other PADDs of Normal Butane-Butylene (Thousand Barrels) | ||||||||
| Decade | Year-0 | Year-1 | Year-2 | Year-3 | Year-4 | Year-5 | Year-6 | Year-7 | Year-8 | Year-9 |
|---|---|---|---|---|---|---|---|---|---|---|
| 1980's | 0 | |||||||||
| 1990's | 42 | 0 | 0 | 0 | 0 | 0 | 50 | 40 | 0 | 494 |
| 2000's | 709 | 760 | 336 | 19 | 0 | 75 | 0 | 0 | 0 | 0 |
| 2010's | 314 | 571 | 1,047 | 1,152 | 2,409 | 2,652 | 3,196 | 3,292 | 4,729 | 2,922 |
| 2020's | 3,553 | 3,580 | -- | -- |
| - = No Data Reported; -- = Not Applicable; NA = Not Available; W = Withheld to avoid disclosure of individual company data. |
| Release Date: 3/29/2024 |
| Next Release Date: 8/30/2024 |
Referring Pages: