|
Download Data (XLS File) |
|
||||||||
|
||||||||
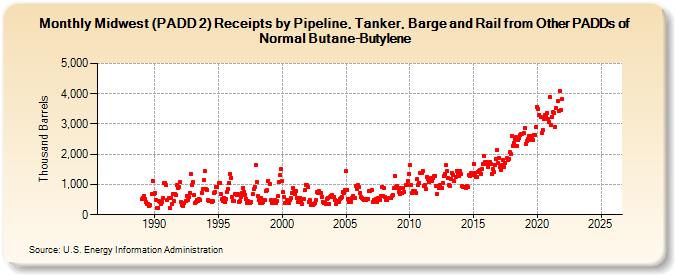
| Midwest (PADD 2) Receipts by Pipeline, Tanker, Barge and Rail from Other PADDs of Normal Butane-Butylene (Thousand Barrels) | ||||||||
| Year | Jan | Feb | Mar | Apr | May | Jun | Jul | Aug | Sep | Oct | Nov | Dec |
|---|---|---|---|---|---|---|---|---|---|---|---|---|
| 1986 | -- | -- | -- | -- | -- | -- | -- | -- | -- | -- | -- | -- |
| 1987 | -- | -- | -- | -- | -- | -- | -- | -- | -- | -- | -- | -- |
| 1988 | -- | -- | -- | -- | -- | -- | -- | -- | -- | -- | -- | -- |
| 1989 | 506 | 565 | 623 | 525 | 427 | 365 | 366 | 290 | 309 | 681 | 1,118 | 669 |
| 1990 | 722 | 503 | 234 | 218 | 453 | 420 | 367 | 424 | 568 | 1,053 | 1,043 | 973 |
| 1991 | 497 | 537 | 234 | 561 | 346 | 689 | 437 | 692 | 655 | 998 | 893 | 922 |
| 1992 | 1,093 | 406 | 310 | 292 | 381 | 450 | 631 | 471 | 595 | 733 | 1,350 | 994 |
| 1993 | 1,074 | 664 | 382 | 423 | 498 | 466 | 517 | 482 | 728 | 843 | 1,146 | 1,450 |
| 1994 | 834 | 833 | 483 | 439 | 466 | 453 | 428 | 441 | 704 | 743 | 914 | 925 |
| 1995 | 1,042 | 1,034 | 685 | 522 | 442 | 567 | 412 | 506 | 751 | 851 | 1,054 | 1,359 |
| 1996 | 1,230 | 598 | 466 | 443 | 683 | 648 | 695 | 433 | 439 | 595 | 730 | 899 |
| 1997 | 763 | 663 | 530 | 398 | 441 | 387 | 398 | 419 | 681 | 838 | 909 | 1,635 |
| 1998 | 1,086 | 611 | 503 | 398 | 562 | 388 | 418 | 486 | 478 | 768 | 807 | 1,117 |
| 1999 | 1,028 | 475 | 403 | 388 | 430 | 486 | 388 | 461 | 608 | 1,092 | 1,305 | 1,507 |
| 2000 | 1,100 | 747 | 570 | 400 | 476 | 442 | 391 | 486 | 560 | 718 | 884 | 746 |
| 2001 | 677 | 800 | 559 | 405 | 447 | 566 | 418 | 350 | 517 | 801 | 993 | 997 |
| 2002 | 919 | 435 | 480 | 330 | 364 | 310 | 344 | 391 | 497 | 739 | 710 | 773 |
| 2003 | 708 | 581 | 421 | 386 | 383 | 358 | 511 | 564 | 364 | 572 | 630 | 658 |
| 2004 | 596 | 585 | 501 | 365 | 468 | 405 | 527 | 544 | 581 | 752 | 724 | 815 |
| 2005 | 1,441 | 829 | 532 | 433 | 444 | 426 | 561 | 629 | 563 | 947 | 860 | 968 |
| 2006 | 902 | 721 | 586 | 541 | 519 | 475 | 515 | 501 | 523 | 515 | 768 | 787 |
| 2007 | 825 | 434 | 487 | 457 | 526 | 419 | 538 | 507 | 484 | 625 | 919 | 605 |
| 2008 | 871 | 579 | 489 | 479 | 542 | 561 | 540 | 608 | 651 | 876 | 1,276 | 901 |
| 2009 | 952 | 868 | 754 | 672 | 869 | 723 | 885 | 751 | 970 | 977 | 1,108 | 1,341 |
| 2010 | 1,630 | 987 | 726 | 789 | 773 | 771 | 703 | 1,180 | 985 | 1,047 | 1,389 | 1,382 |
| 2011 | 1,451 | 961 | 981 | 861 | 1,254 | 1,183 | 1,093 | 1,147 | 1,202 | 1,102 | 1,230 | 1,270 |
| 2012 | 1,279 | 963 | 687 | 873 | 978 | 876 | 881 | 1,035 | 1,267 | 1,349 | 1,628 | 1,431 |
| 2013 | 1,200 | 978 | 954 | 1,177 | 1,376 | 1,313 | 1,102 | 1,259 | 1,455 | 1,356 | 1,288 | 1,442 |
| 2014 | 1,356 | 941 | 930 | 928 | 918 | 890 | 947 | 909 | 1,325 | 1,291 | 1,387 | 1,321 |
| 2015 | 1,687 | 1,384 | 1,244 | 1,254 | 1,415 | 1,450 | 1,494 | 1,355 | 1,507 | 1,668 | 1,938 | 1,741 |
| 2016 | 1,759 | 1,686 | 1,566 | 1,740 | 1,685 | 1,338 | 1,511 | 1,413 | 1,644 | 1,842 | 2,145 | 1,704 |
| 2017 | 1,873 | 1,571 | 1,489 | 1,636 | 1,804 | 1,587 | 1,709 | 1,871 | 1,793 | 1,854 | 2,058 | 1,991 |
| 2018 | 2,610 | 2,278 | 2,378 | 2,488 | 2,557 | 2,272 | 2,456 | 2,552 | 2,625 | 2,684 | 2,684 | 2,694 |
| 2019 | 2,878 | 2,349 | 2,431 | 2,514 | 2,610 | 2,463 | 2,570 | 2,616 | 2,456 | 2,626 | 2,650 | 2,900 |
| 2020 | 3,572 | 3,488 | 3,309 | 3,221 | 2,688 | 2,795 | 3,165 | 3,287 | 3,271 | 3,355 | 3,172 | 3,057 |
| 2021 | 3,887 | 2,971 | 3,240 | 3,390 | 3,364 | 2,886 | 3,533 | 3,757 | 3,434 | 4,105 | 3,453 | 3,825 |
| 2022 | -- | -- | -- | -- | -- | -- | -- | -- | -- | -- | -- | -- |
| 2023 | -- | -- | -- | -- | -- | -- | -- | -- | -- | -- | -- | -- |
| 2024 | -- | |||||||||||
| - = No Data Reported; -- = Not Applicable; NA = Not Available; W = Withheld to avoid disclosure of individual company data. |
| Release Date: 3/29/2024 |
| Next Release Date: 4/30/2024 |