|
Download Data (XLS File) |
|
||||||||
|
||||||||
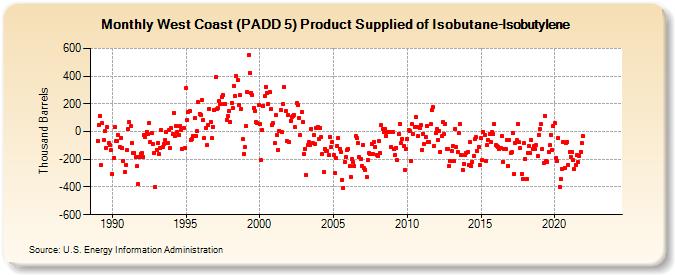
| West Coast (PADD 5) Product Supplied of Isobutane-Isobutylene (Thousand Barrels) | ||||||||
| Year | Jan | Feb | Mar | Apr | May | Jun | Jul | Aug | Sep | Oct | Nov | Dec |
|---|---|---|---|---|---|---|---|---|---|---|---|---|
| 1989 | -65 | 44 | 113 | -242 | 59 | -62 | 3 | -116 | 30 | -86 | -96 | -136 |
| 1990 | -306 | -190 | 31 | -70 | -66 | -28 | -110 | -46 | -119 | -211 | -291 | -241 |
| 1991 | -134 | 19 | 70 | 38 | -84 | -158 | -156 | -185 | -251 | -380 | -180 | -160 |
| 1992 | -156 | -182 | -26 | -42 | 0 | -18 | 65 | -76 | -9 | -92 | -156 | -399 |
| 1993 | -130 | -83 | -164 | -122 | 10 | -115 | -87 | -59 | -5 | -85 | 8 | -117 |
| 1994 | 23 | -20 | 136 | -35 | 39 | -2 | -24 | 40 | 10 | -123 | 26 | -116 |
| 1995 | 316 | 84 | 144 | 147 | -58 | -53 | -31 | 97 | -29 | 1 | 210 | 130 |
| 1996 | 119 | 230 | 83 | -48 | 26 | -100 | 44 | 165 | 70 | -48 | 33 | 153 |
| 1997 | 391 | 166 | 168 | 217 | 198 | 250 | 264 | 199 | 202 | 86 | 112 | 150 |
| 1998 | 70 | 206 | 169 | 332 | 253 | 399 | 373 | 190 | 264 | 166 | -54 | -161 |
| 1999 | -114 | 39 | 284 | 552 | 425 | 280 | 265 | 169 | 148 | 68 | 60 | 190 |
| 2000 | 52 | -207 | 10 | 187 | 255 | 324 | 276 | 199 | 286 | 161 | 47 | 59 |
| 2001 | -86 | 117 | -22 | -130 | 5 | 156 | -6 | 196 | 323 | 147 | -70 | 117 |
| 2002 | -78 | 78 | 103 | 114 | 119 | 30 | 204 | 193 | 99 | -28 | 140 | 72 |
| 2003 | -160 | -124 | -313 | -98 | -74 | -100 | 19 | -85 | -25 | -87 | 26 | 35 |
| 2004 | -52 | 24 | -40 | -161 | -292 | -124 | -140 | -140 | -171 | -37 | -115 | -76 |
| 2005 | -168 | -299 | -193 | -101 | -46 | -128 | -150 | -347 | -405 | -218 | -184 | -132 |
| 2006 | -125 | -252 | -326 | -201 | -220 | -250 | -34 | -48 | -85 | -185 | -197 | -245 |
| 2007 | -94 | -264 | -275 | -325 | -205 | -158 | -160 | -88 | -160 | -75 | -110 | -170 |
| 2008 | -177 | -70 | -152 | 45 | 17 | -3 | 22 | -33 | -5 | -1 | 0 | -110 |
| 2009 | -5 | -126 | -167 | -116 | -208 | -16 | 58 | -86 | -55 | -107 | -276 | -125 |
| 2010 | -51 | 11 | 5 | -209 | 51 | -20 | 35 | 104 | 35 | -32 | 25 | 44 |
| 2011 | -130 | -18 | -89 | -41 | 40 | -73 | -77 | 52 | 155 | 175 | -103 | -8 |
| 2012 | 18 | -60 | 4 | -145 | -34 | 66 | -19 | 58 | -127 | -124 | -248 | -214 |
| 2013 | -141 | -104 | -213 | 22 | -108 | -144 | -14 | 52 | -167 | -276 | -232 | -170 |
| 2014 | -154 | -148 | -240 | -76 | -249 | -217 | -174 | -57 | -42 | -140 | -109 | -242 |
| 2015 | -49 | -208 | -4 | -22 | -210 | -98 | -64 | -17 | -75 | -5 | -21 | 54 |
| 2016 | -99 | -101 | -109 | -128 | -121 | -35 | -219 | -125 | -129 | -61 | -248 | -59 |
| 2017 | -153 | -150 | -8 | -304 | -81 | -63 | 56 | -78 | -119 | -304 | -339 | -85 |
| 2018 | -197 | -342 | -154 | -105 | -158 | -60 | -126 | -107 | -126 | -100 | -178 | -25 |
| 2019 | 15 | 51 | -126 | -229 | 115 | -211 | -217 | -146 | -99 | -26 | -133 | 37 |
| 2020 | 61 | -191 | -212 | -48 | -399 | -344 | -268 | -72 | -263 | -86 | -73 | -242 |
| 2021 | -147 | -182 | -145 | -207 | -271 | -243 | -169 | -219 | -174 | -145 | -85 | -35 |
| 2022 | -- | -- | -- | -- | -- | -- | -- | -- | -- | -- | -- | -- |
| 2023 | -- | -- | -- | -- | -- | -- | -- | -- | -- | -- | -- | -- |
| 2024 | -- | |||||||||||
| - = No Data Reported; -- = Not Applicable; NA = Not Available; W = Withheld to avoid disclosure of individual company data. |
| Release Date: 3/29/2024 |
| Next Release Date: 4/30/2024 |