|
Download Data (XLS File) |
|
||||||||
|
||||||||
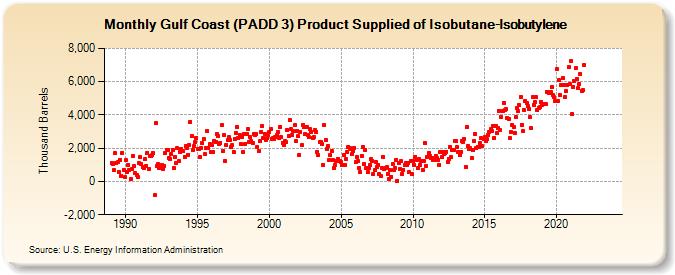
| Gulf Coast (PADD 3) Product Supplied of Isobutane-Isobutylene (Thousand Barrels) | ||||||||
| Year | Jan | Feb | Mar | Apr | May | Jun | Jul | Aug | Sep | Oct | Nov | Dec |
|---|---|---|---|---|---|---|---|---|---|---|---|---|
| 1989 | 1,118 | 1,040 | 669 | 1,683 | 1,132 | 1,145 | 592 | 1,307 | 348 | 1,725 | 693 | 241 |
| 1990 | 1,274 | 556 | 995 | 715 | 128 | 743 | 1,541 | 907 | 480 | 404 | 242 | 1,108 |
| 1991 | 1,464 | 1,056 | 841 | 822 | 1,328 | 950 | 1,717 | 737 | 1,524 | 1,521 | 1,609 | 1,705 |
| 1992 | -831 | 3,502 | 937 | 1,027 | 788 | 958 | 998 | 761 | 955 | 1,715 | 1,905 | 1,904 |
| 1993 | 1,394 | 1,362 | 1,674 | 1,908 | 800 | 1,476 | 1,121 | 1,986 | 1,218 | 1,797 | 1,981 | 1,836 |
| 1994 | 1,829 | 1,498 | 2,127 | 1,992 | 1,615 | 2,197 | 3,590 | 2,705 | 1,896 | 2,106 | 2,344 | 2,633 |
| 1995 | 1,966 | 1,966 | 1,481 | 2,025 | 2,325 | 2,547 | 1,627 | 2,034 | 3,053 | 2,040 | 2,223 | 1,742 |
| 1996 | 2,176 | 1,776 | 2,451 | 2,391 | 2,831 | 2,706 | 2,277 | 2,324 | 3,366 | 1,823 | 2,781 | 1,228 |
| 1997 | 2,212 | 2,489 | 2,651 | 2,495 | 2,054 | 2,188 | 1,788 | 2,549 | 2,907 | 3,261 | 2,608 | 2,805 |
| 1998 | 2,264 | 2,673 | 1,794 | 2,860 | 2,252 | 2,869 | 3,153 | 2,359 | 2,670 | 2,421 | 2,310 | 2,874 |
| 1999 | 2,782 | 2,859 | 2,065 | 1,802 | 2,405 | 2,961 | 3,333 | 2,632 | 2,870 | 2,502 | 2,591 | 2,809 |
| 2000 | 2,966 | 3,172 | 2,578 | 2,597 | 2,582 | 2,663 | 2,771 | 2,992 | 2,625 | 3,287 | 2,663 | 2,337 |
| 2001 | 2,211 | 2,414 | 2,354 | 3,089 | 2,741 | 3,713 | 3,147 | 2,815 | 3,013 | 3,376 | 2,420 | 3,049 |
| 2002 | 2,710 | 1,612 | 2,972 | 2,166 | 3,421 | 3,276 | 2,852 | 3,264 | 2,770 | 2,665 | 3,136 | 2,968 |
| 2003 | 2,640 | 2,665 | 3,093 | 2,994 | 1,771 | 1,564 | 2,343 | 2,348 | 2,257 | 997 | 3,366 | 2,465 |
| 2004 | 1,947 | 2,114 | 1,309 | 1,565 | 1,839 | 1,300 | 831 | 994 | 1,259 | 1,379 | 1,229 | 1,249 |
| 2005 | 1,147 | 1,000 | 1,564 | 973 | 1,345 | 1,783 | 2,086 | 2,012 | 1,935 | 1,627 | 1,803 | 2,022 |
| 2006 | 1,157 | 1,459 | 1,227 | 822 | 561 | 1,543 | 2,064 | 1,020 | 1,871 | 790 | 567 | 797 |
| 2007 | 982 | 1,327 | 1,243 | 462 | 685 | 1,174 | 888 | 1,012 | 441 | 298 | 824 | 1,471 |
| 2008 | 772 | 832 | 842 | 463 | 155 | 664 | 292 | 1,037 | 676 | 835 | 1,318 | 49 |
| 2009 | 1,086 | 737 | 1,213 | 469 | 706 | 974 | 1,093 | 981 | 1,091 | 548 | 1,244 | 464 |
| 2010 | 1,226 | 1,002 | 1,494 | 1,305 | 796 | 1,347 | 1,014 | 1,232 | 690 | 1,229 | 2,331 | 941 |
| 2011 | 1,445 | 1,698 | 1,515 | 1,424 | 1,419 | 1,261 | 1,282 | 1,550 | 1,380 | 1,317 | 1,014 | 1,760 |
| 2012 | 1,468 | 1,785 | 1,622 | 1,704 | 1,787 | 1,162 | 1,371 | 2,098 | 1,442 | 1,861 | 1,896 | 2,429 |
| 2013 | 2,416 | 2,045 | 1,775 | 1,599 | 1,800 | 2,403 | 2,397 | 2,565 | 878 | 3,272 | 2,140 | 1,953 |
| 2014 | 1,985 | 1,419 | 1,871 | 2,407 | 2,855 | 2,009 | 2,094 | 2,062 | 2,320 | 2,589 | 2,104 | 2,531 |
| 2015 | 2,665 | 2,442 | 2,528 | 2,787 | 2,962 | 3,136 | 3,031 | 3,342 | 2,623 | 3,340 | 2,889 | 3,239 |
| 2016 | 4,262 | 3,098 | 3,878 | 4,235 | 4,742 | 4,296 | 4,336 | 3,807 | 3,763 | 2,595 | 2,954 | 3,386 |
| 2017 | 3,303 | 2,915 | 3,848 | 4,406 | 4,213 | 4,580 | 5,103 | 3,418 | 3,025 | 4,283 | 4,835 | 4,694 |
| 2018 | 4,511 | 4,376 | 3,870 | 3,194 | 5,075 | 4,603 | 4,756 | 5,059 | 4,289 | 4,401 | 4,474 | 4,806 |
| 2019 | 4,603 | 4,627 | 4,641 | 4,627 | 5,408 | 5,374 | 5,300 | 5,360 | 5,658 | 5,176 | 5,054 | 4,837 |
| 2020 | 6,752 | 4,811 | 6,089 | 5,179 | 5,822 | 6,216 | 5,778 | 5,079 | 5,416 | 5,786 | 6,860 | 5,830 |
| 2021 | 7,224 | 4,065 | 5,688 | 6,060 | 6,807 | 6,189 | 5,595 | 5,859 | 6,448 | 5,461 | 5,492 | 7,011 |
| 2022 | -- | -- | -- | -- | -- | -- | -- | -- | -- | -- | -- | -- |
| 2023 | -- | -- | -- | -- | -- | -- | -- | -- | -- | -- | -- | -- |
| 2024 | -- | |||||||||||
| - = No Data Reported; -- = Not Applicable; NA = Not Available; W = Withheld to avoid disclosure of individual company data. |
| Release Date: 3/29/2024 |
| Next Release Date: 4/30/2024 |