|
Download Data (XLS File) |
|
||||||||
|
||||||||
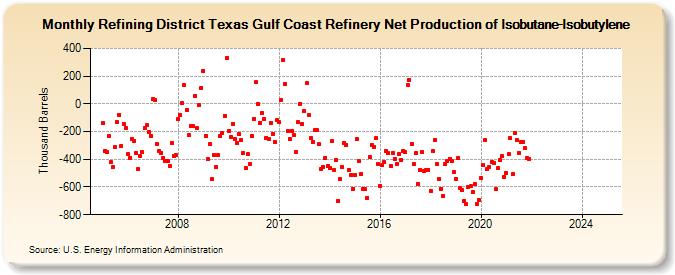
| Refining District Texas Gulf Coast Refinery Net Production of Isobutane-Isobutylene (Thousand Barrels) | ||||||||
| Year | Jan | Feb | Mar | Apr | May | Jun | Jul | Aug | Sep | Oct | Nov | Dec |
|---|---|---|---|---|---|---|---|---|---|---|---|---|
| 2005 | -141 | -339 | -346 | -229 | -421 | -458 | -311 | -133 | -81 | -306 | -144 | -171 |
| 2006 | -365 | -389 | -252 | -266 | -352 | -472 | -379 | -350 | -174 | -153 | -201 | -230 |
| 2007 | 34 | 25 | -287 | -338 | -355 | -388 | -414 | -413 | -446 | -285 | -374 | -369 |
| 2008 | -111 | -84 | 4 | 133 | -45 | -227 | -158 | -160 | 57 | -173 | -10 | 116 |
| 2009 | 238 | -230 | -401 | -289 | -544 | -368 | -456 | -372 | -234 | -210 | -85 | 334 |
| 2010 | -197 | -238 | -144 | -254 | -280 | -221 | -261 | -356 | -461 | -365 | -436 | -232 |
| 2011 | -107 | 156 | 0 | -137 | -66 | -110 | -245 | -257 | -135 | -216 | -273 | -120 |
| 2012 | -133 | 29 | 319 | 142 | -199 | -252 | -195 | -228 | -345 | -132 | 1 | -145 |
| 2013 | -55 | 148 | -79 | -248 | -275 | -188 | -191 | -293 | -467 | -453 | -389 | -447 |
| 2014 | -463 | -269 | -480 | -404 | -701 | -541 | -454 | -281 | -295 | -478 | -516 | -612 |
| 2015 | -513 | -255 | -412 | -505 | -616 | -617 | -676 | -383 | -297 | -309 | -248 | -432 |
| 2016 | -590 | -442 | -419 | -339 | -357 | -446 | -356 | -396 | -431 | -365 | -402 | -337 |
| 2017 | -350 | 134 | 174 | -287 | -437 | -357 | -575 | -474 | -348 | -483 | -475 | -475 |
| 2018 | -628 | -342 | -260 | -436 | -541 | -611 | -663 | -437 | -414 | -397 | -413 | -495 |
| 2019 | -541 | -394 | -608 | -622 | -702 | -723 | -597 | -596 | -636 | -578 | -721 | -693 |
| 2020 | -533 | -440 | -260 | -473 | -456 | -421 | -424 | -616 | -465 | -406 | -377 | -526 |
| 2021 | -499 | -365 | -247 | -507 | -213 | -263 | -352 | -273 | -274 | -317 | -391 | -400 |
| 2022 | -- | -- | -- | -- | -- | -- | -- | -- | -- | -- | -- | -- |
| 2023 | -- | -- | -- | -- | -- | -- | -- | -- | -- | -- | -- | -- |
| 2024 | -- | |||||||||||
| - = No Data Reported; -- = Not Applicable; NA = Not Available; W = Withheld to avoid disclosure of individual company data. |
| Release Date: 3/29/2024 |
| Next Release Date: 4/30/2024 |