|
Download Data (XLS File) |
|
||||||||
|
||||||||
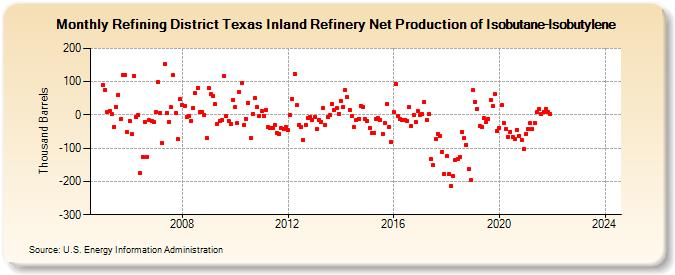
| Refining District Texas Inland Refinery Net Production of Isobutane-Isobutylene (Thousand Barrels) | ||||||||
| Year | Jan | Feb | Mar | Apr | May | Jun | Jul | Aug | Sep | Oct | Nov | Dec |
|---|---|---|---|---|---|---|---|---|---|---|---|---|
| 2005 | 90 | 76 | 8 | 13 | 2 | -35 | 25 | 61 | -13 | 120 | 121 | -52 |
| 2006 | -18 | -57 | 118 | -6 | -1 | -176 | -125 | -20 | -125 | -16 | -17 | -22 |
| 2007 | 8 | 99 | 6 | -84 | 153 | 7 | -20 | 23 | 119 | 6 | -73 | 47 |
| 2008 | 30 | 27 | -5 | -4 | -18 | 22 | 65 | 82 | 10 | 8 | 0 | -70 |
| 2009 | 80 | 62 | 57 | 32 | -26 | -18 | -16 | 116 | -3 | -17 | -28 | 45 |
| 2010 | 23 | -25 | 70 | 97 | -29 | -12 | 37 | -68 | 3 | 50 | 23 | -2 |
| 2011 | 12 | -3 | 16 | -36 | -40 | -38 | -29 | -54 | -57 | -40 | -43 | -36 |
| 2012 | -46 | -1 | 49 | 124 | 29 | -29 | -36 | -76 | -30 | -8 | -6 | -16 |
| 2013 | -5 | -43 | -14 | -20 | 21 | -29 | -7 | -1 | 33 | 15 | 20 | 3 |
| 2014 | 42 | 25 | 75 | 53 | 16 | -4 | -37 | -16 | -12 | 28 | 25 | -12 |
| 2015 | -18 | -38 | -53 | -54 | -13 | -10 | -16 | -56 | -24 | 34 | -35 | -82 |
| 2016 | 9 | 93 | -3 | -13 | -14 | -15 | -17 | 24 | -34 | -1 | -22 | 11 |
| 2017 | 1 | 3 | 40 | -16 | 4 | -133 | -151 | -73 | -56 | -64 | -110 | -177 |
| 2018 | -124 | -178 | -215 | -183 | -135 | -133 | -127 | -52 | -70 | -90 | -164 | -197 |
| 2019 | 74 | 40 | 18 | -33 | -37 | -10 | -22 | -13 | 46 | 26 | 63 | -49 |
| 2020 | -40 | 29 | -23 | -42 | -65 | -50 | -66 | -71 | -44 | -63 | -74 | -103 |
| 2021 | -57 | -42 | -25 | -42 | -24 | 8 | 17 | 2 | 10 | 18 | 8 | 2 |
| 2022 | -- | -- | -- | -- | -- | -- | -- | -- | -- | -- | -- | -- |
| 2023 | -- | -- | -- | -- | -- | -- | -- | -- | -- | -- | -- | -- |
| 2024 | -- | |||||||||||
| - = No Data Reported; -- = Not Applicable; NA = Not Available; W = Withheld to avoid disclosure of individual company data. |
| Release Date: 3/29/2024 |
| Next Release Date: 4/30/2024 |