|
Download Data (XLS File) |
|
||||||||
|
||||||||
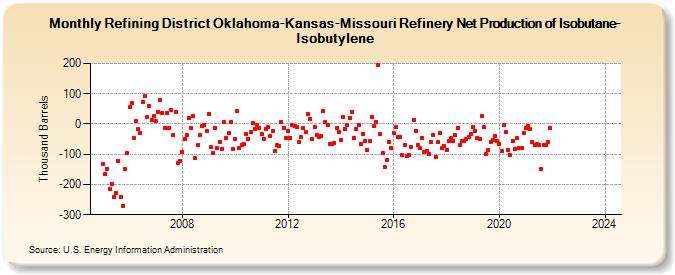
| Refining District Oklahoma-Kansas-Missouri Refinery Net Production of Isobutane-Isobutylene (Thousand Barrels) | ||||||||
| Year | Jan | Feb | Mar | Apr | May | Jun | Jul | Aug | Sep | Oct | Nov | Dec |
|---|---|---|---|---|---|---|---|---|---|---|---|---|
| 2005 | -133 | -166 | -148 | -214 | -198 | -240 | -228 | -122 | -240 | -271 | -148 | -97 |
| 2006 | 55 | 70 | -48 | 9 | -17 | -30 | 73 | 92 | 23 | 60 | 12 | 27 |
| 2007 | 11 | 40 | 78 | 35 | -14 | 36 | -12 | 46 | -35 | 40 | -129 | -121 |
| 2008 | -93 | -50 | -35 | 19 | -13 | 26 | -113 | -71 | -37 | -6 | -3 | -22 |
| 2009 | 34 | -77 | -96 | -13 | -81 | -58 | -82 | 5 | -48 | -30 | 8 | -83 |
| 2010 | -51 | 43 | -79 | -69 | -67 | -34 | -49 | -27 | 3 | -15 | -2 | -14 |
| 2011 | -33 | -49 | -16 | -10 | -41 | -24 | -89 | -70 | -72 | 6 | -14 | -45 |
| 2012 | -24 | -46 | -4 | -6 | -11 | -58 | -44 | -12 | -26 | 34 | 17 | -51 |
| 2013 | -9 | -35 | -43 | -40 | 44 | 5 | -4 | -67 | -65 | -62 | -13 | -25 |
| 2014 | -52 | 23 | -17 | -5 | 21 | 40 | -45 | -17 | -4 | -66 | -32 | -57 |
| 2015 | -86 | -57 | 23 | -7 | 8 | 194 | -34 | -95 | -142 | -119 | -59 | -80 |
| 2016 | -29 | -11 | -43 | -43 | -103 | -68 | -107 | -101 | -75 | 13 | -22 | -69 |
| 2017 | -81 | -48 | -93 | -90 | -99 | -60 | -35 | -108 | -61 | -30 | -80 | -74 |
| 2018 | -85 | -56 | -46 | -55 | -38 | -12 | -70 | -55 | -57 | -49 | -44 | -33 |
| 2019 | -10 | -22 | -45 | -51 | 27 | -10 | -100 | -87 | -60 | -53 | -39 | -57 |
| 2020 | -66 | -89 | -3 | -25 | -87 | -103 | -56 | -83 | -48 | -79 | -81 | -29 |
| 2021 | -14 | -8 | -17 | -60 | -71 | -67 | -70 | -150 | -69 | -71 | -59 | -13 |
| 2022 | -- | -- | -- | -- | -- | -- | -- | -- | -- | -- | -- | -- |
| 2023 | -- | -- | -- | -- | -- | -- | -- | -- | -- | -- | -- | -- |
| 2024 | -- | |||||||||||
| - = No Data Reported; -- = Not Applicable; NA = Not Available; W = Withheld to avoid disclosure of individual company data. |
| Release Date: 3/29/2024 |
| Next Release Date: 4/30/2024 |