|
Download Data (XLS File) |
|
||||||||
|
||||||||
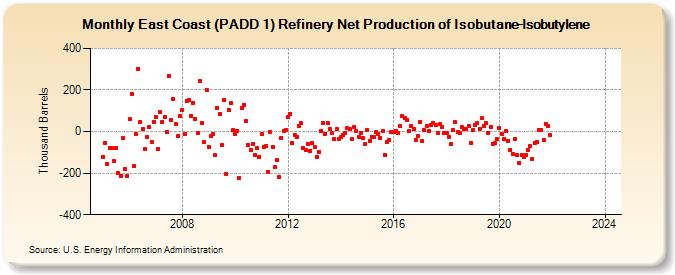
| East Coast (PADD 1) Refinery Net Production of Isobutane-Isobutylene (Thousand Barrels) | ||||||||
| Year | Jan | Feb | Mar | Apr | May | Jun | Jul | Aug | Sep | Oct | Nov | Dec |
|---|---|---|---|---|---|---|---|---|---|---|---|---|
| 2005 | -122 | -53 | -156 | -78 | -78 | -143 | -78 | -200 | -212 | -33 | -178 | -213 |
| 2006 | 59 | 182 | -165 | -12 | 301 | 48 | 10 | -84 | -28 | 22 | -51 | 48 |
| 2007 | 72 | -82 | 92 | 48 | 72 | -2 | 267 | 57 | 156 | 36 | -20 | 73 |
| 2008 | 106 | -14 | 149 | 152 | 73 | 135 | 62 | -7 | 241 | 40 | -52 | 201 |
| 2009 | -74 | -23 | -14 | -114 | 115 | 86 | -66 | 153 | -202 | 106 | 137 | 6 |
| 2010 | -11 | 3 | -222 | 111 | 130 | 49 | -65 | -87 | -59 | -112 | -81 | -120 |
| 2011 | -13 | -72 | -71 | -194 | -2 | -74 | -171 | -137 | -221 | -31 | 4 | 7 |
| 2012 | 70 | 84 | -54 | -15 | -26 | 28 | 40 | -79 | -89 | -58 | -92 | -57 |
| 2013 | -76 | -121 | -97 | 5 | 43 | -11 | 42 | 13 | -7 | -35 | 11 | -34 |
| 2014 | -27 | -17 | -8 | 17 | 12 | -36 | 20 | 2 | -26 | -5 | -32 | -61 |
| 2015 | 8 | -46 | -26 | -25 | -3 | -12 | -29 | 4 | -113 | -52 | -39 | 0 |
| 2016 | -4 | 1 | -6 | 25 | 76 | 63 | 57 | 2 | 26 | 11 | -40 | -20 |
| 2017 | 47 | -46 | 8 | 26 | 4 | 33 | 43 | 31 | -6 | 36 | 24 | -7 |
| 2018 | -9 | -25 | -61 | 6 | 44 | -3 | -7 | 20 | 10 | 12 | 26 | -53 |
| 2019 | 8 | 30 | 39 | 14 | 63 | 25 | 41 | -5 | 23 | -59 | -55 | -38 |
| 2020 | 17 | -14 | -37 | 5 | -44 | -88 | -109 | -37 | -115 | -151 | -114 | -123 |
| 2021 | -111 | -89 | -71 | -134 | -55 | -48 | 8 | 8 | -40 | 38 | 29 | -17 |
| 2022 | -- | -- | -- | -- | -- | -- | -- | -- | -- | -- | -- | -- |
| 2023 | -- | -- | -- | -- | -- | -- | -- | -- | -- | -- | -- | -- |
| 2024 | -- | |||||||||||
| - = No Data Reported; -- = Not Applicable; NA = Not Available; W = Withheld to avoid disclosure of individual company data. |
| Release Date: 3/29/2024 |
| Next Release Date: 4/30/2024 |