|
Download Data (XLS File) |
|
||||||||
|
||||||||
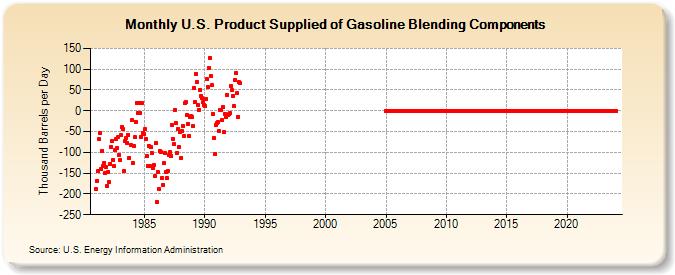
| U.S. Product Supplied of Gasoline Blending Components (Thousand Barrels per Day) | ||||||||
| Year | Jan | Feb | Mar | Apr | May | Jun | Jul | Aug | Sep | Oct | Nov | Dec |
|---|---|---|---|---|---|---|---|---|---|---|---|---|
| 1981 | -188 | -168 | -146 | -68 | -54 | -141 | -96 | -133 | -125 | -150 | -135 | -181 |
| 1982 | -147 | -172 | -127 | -87 | -72 | -118 | -133 | -95 | -69 | -90 | -62 | -106 |
| 1983 | -119 | -59 | -39 | -45 | -145 | -72 | -65 | -77 | -58 | -113 | -82 | -23 |
| 1984 | -125 | -84 | -64 | -26 | 19 | -5 | 19 | -5 | -62 | 18 | -53 | -56 |
| 1985 | -45 | -69 | -109 | -133 | -84 | -132 | -88 | -101 | -138 | -130 | -158 | -78 |
| 1986 | -219 | -147 | -189 | -97 | -99 | -162 | -178 | -126 | -102 | -147 | -162 | -145 |
| 1987 | -107 | -100 | -108 | -34 | -67 | -81 | 2 | -30 | -101 | -44 | -87 | -51 |
| 1988 | -114 | -49 | -36 | -61 | 18 | 20 | -11 | -31 | -61 | -15 | -13 | -16 |
| 1989 | -37 | 55 | 20 | 89 | 69 | 13 | 2 | 50 | 35 | 30 | 20 | 15 |
| 1990 | 12 | 28 | 76 | 56 | 103 | 128 | 83 | 61 | -8 | -66 | -104 | -35 |
| 1991 | -30 | -27 | -48 | 2 | 1 | -22 | 9 | -52 | -7 | -14 | 39 | -11 |
| 1992 | -8 | -6 | 59 | 49 | 36 | 11 | 75 | 91 | 43 | -14 | 68 | 66 |
| 2005 | 0 | 0 | 0 | 0 | 0 | 0 | 0 | 0 | 0 | 0 | 0 | 0 |
| 2006 | 0 | 0 | 0 | 0 | 0 | 0 | 0 | 0 | 0 | 0 | 0 | 0 |
| 2007 | 0 | 0 | 0 | 0 | 0 | 0 | 0 | 0 | 0 | 0 | 0 | 0 |
| 2008 | 0 | 0 | 0 | 0 | 0 | 0 | 0 | 0 | 0 | 0 | 0 | 0 |
| 2009 | 0 | 0 | 0 | 0 | 0 | 0 | 0 | 0 | 0 | 0 | 0 | 0 |
| 2010 | 0 | 0 | 0 | 0 | 0 | 0 | 0 | 0 | 0 | 0 | 0 | 0 |
| 2011 | 0 | 0 | 0 | 0 | 0 | 0 | 0 | 0 | 0 | 0 | 0 | 0 |
| 2012 | 0 | 0 | 0 | 0 | 0 | 0 | 0 | 0 | 0 | 0 | 0 | 0 |
| 2013 | 0 | 0 | 0 | 0 | 0 | 0 | 0 | 0 | 0 | 0 | 0 | 0 |
| 2014 | 0 | 0 | 0 | 0 | 0 | 0 | 0 | 0 | 0 | 0 | 0 | 0 |
| 2015 | 0 | 0 | 0 | 0 | 0 | 0 | 0 | 0 | 0 | 0 | 0 | 0 |
| 2016 | 0 | 0 | 0 | 0 | 0 | 0 | 0 | 0 | 0 | 0 | 0 | 0 |
| 2017 | 0 | 0 | 0 | 0 | 0 | 0 | 0 | 0 | 0 | 0 | 0 | 0 |
| 2018 | 0 | 0 | 0 | 0 | 0 | 0 | 0 | 0 | 0 | 0 | 0 | 0 |
| 2019 | 0 | 0 | 0 | 0 | 0 | 0 | 0 | 0 | 0 | 0 | 0 | 0 |
| 2020 | 0 | 0 | 0 | 0 | 0 | 0 | 0 | 0 | 0 | 0 | 0 | 0 |
| 2021 | 0 | 0 | 0 | 0 | 0 | 0 | 0 | 0 | 0 | 0 | 0 | 0 |
| 2022 | 0 | 0 | 0 | 0 | 0 | 0 | 0 | 0 | 0 | 0 | 0 | 0 |
| 2023 | 0 | 0 | 0 | 0 | 0 | 0 | 0 | 0 | 0 | 0 | 0 | 0 |
| 2024 | 0 | |||||||||||
| - = No Data Reported; -- = Not Applicable; NA = Not Available; W = Withheld to avoid disclosure of individual company data. |
| Release Date: 3/29/2024 |
| Next Release Date: 4/30/2024 |