|
Download Data (XLS File) |
|
||||||||
|
||||||||
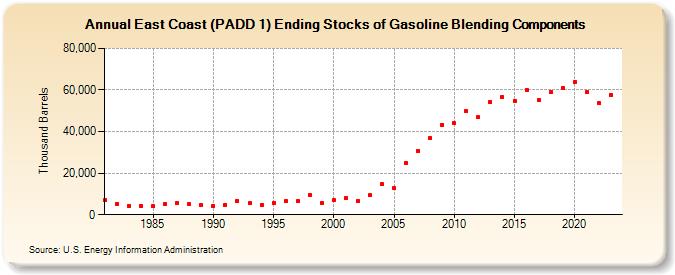
| East Coast (PADD 1) Ending Stocks of Gasoline Blending Components (Thousand Barrels) | ||||||||
| Decade | Year-0 | Year-1 | Year-2 | Year-3 | Year-4 | Year-5 | Year-6 | Year-7 | Year-8 | Year-9 |
|---|---|---|---|---|---|---|---|---|---|---|
| 1980's | 6,915 | 5,281 | 4,337 | 4,285 | 4,121 | 5,103 | 5,505 | 4,920 | 4,437 | |
| 1990's | 4,234 | 4,863 | 6,612 | 5,575 | 4,751 | 5,758 | 6,470 | 6,396 | 9,667 | 5,715 |
| 2000's | 6,841 | 7,966 | 6,698 | 9,257 | 14,744 | 12,624 | 24,936 | 30,803 | 36,968 | 43,366 |
| 2010's | 43,890 | 49,848 | 46,851 | 54,174 | 56,683 | 54,884 | 59,887 | 55,137 | 59,014 | 60,982 |
| 2020's | 63,960 | 58,914 | 53,504 | 57,721 |
| - = No Data Reported; -- = Not Applicable; NA = Not Available; W = Withheld to avoid disclosure of individual company data. |
| Release Date: 3/29/2024 |
| Next Release Date: 8/30/2024 |