|
Download Data (XLS File) |
|
||||||||
|
||||||||
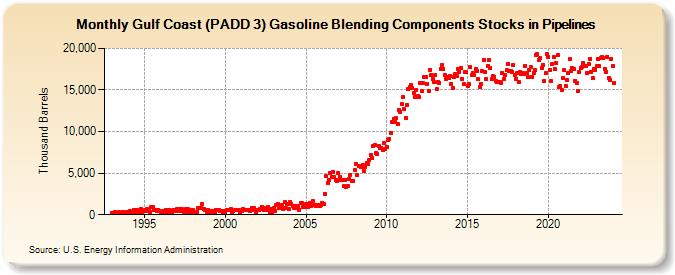
| Gulf Coast (PADD 3) Gasoline Blending Components Stocks in Pipelines (Thousand Barrels) | ||||||||
| Year | Jan | Feb | Mar | Apr | May | Jun | Jul | Aug | Sep | Oct | Nov | Dec |
|---|---|---|---|---|---|---|---|---|---|---|---|---|
| 1993 | 148 | 203 | 293 | 253 | 154 | 349 | 147 | 261 | 268 | 185 | 233 | 302 |
| 1994 | 277 | 432 | 304 | 315 | 556 | 374 | 607 | 413 | 377 | 747 | 374 | 483 |
| 1995 | 575 | 418 | 652 | 470 | 359 | 971 | 896 | 547 | 625 | 469 | 574 | 499 |
| 1996 | 279 | 332 | 438 | 268 | 615 | 345 | 626 | 327 | 251 | 521 | 569 | 465 |
| 1997 | 677 | 457 | 690 | 421 | 654 | 351 | 313 | 641 | 631 | 293 | 219 | 555 |
| 1998 | 554 | 362 | 351 | 361 | 763 | 797 | 866 | 1,273 | 668 | 616 | 330 | 547 |
| 1999 | 489 | 328 | 464 | 424 | 266 | 582 | 541 | 577 | 473 | 462 | 380 | 460 |
| 2000 | 216 | 607 | 605 | 621 | 630 | 338 | 430 | 588 | 530 | 508 | 581 | 199 |
| 2001 | 422 | 685 | 601 | 548 | 507 | 582 | 481 | 538 | 777 | 848 | 617 | 337 |
| 2002 | 604 | 550 | 739 | 943 | 792 | 517 | 832 | 609 | 907 | 190 | 704 | 293 |
| 2003 | 822 | 501 | 1,183 | 1,296 | 788 | 1,011 | 1,161 | 734 | 1,525 | 799 | 1,248 | 687 |
| 2004 | 1,539 | 1,292 | 1,028 | 775 | 1,073 | 831 | 1,095 | 623 | 1,403 | 1,386 | 968 | 972 |
| 2005 | 1,348 | 869 | 1,235 | 1,420 | 1,060 | 1,618 | 1,203 | 1,024 | 1,206 | 1,124 | 1,075 | 1,168 |
| 2006 | 1,441 | 1,323 | 2,516 | 4,618 | 3,810 | 4,180 | 4,972 | 4,516 | 5,147 | 4,560 | 4,208 | 4,080 |
| 2007 | 4,980 | 4,586 | 4,144 | 4,133 | 3,448 | 4,178 | 3,389 | 3,471 | 4,323 | 4,826 | 4,062 | 4,082 |
| 2008 | 5,374 | 6,120 | 4,771 | 5,875 | 5,821 | 5,727 | 5,992 | 5,297 | 5,711 | 6,253 | 6,132 | 6,587 |
| 2009 | 7,234 | 6,827 | 8,250 | 8,431 | 7,442 | 7,281 | 8,285 | 8,081 | 8,071 | 7,746 | 8,565 | 7,929 |
| 2010 | 8,198 | 9,019 | 9,160 | 9,812 | 11,107 | 11,481 | 11,153 | 11,639 | 10,858 | 12,622 | 12,399 | 13,314 |
| 2011 | 14,100 | 12,662 | 11,657 | 13,188 | 15,081 | 15,298 | 15,565 | 15,252 | 14,669 | 14,195 | 15,017 | 14,330 |
| 2012 | 14,214 | 15,855 | 14,906 | 15,833 | 16,539 | 16,550 | 15,730 | 14,907 | 17,436 | 16,803 | 16,320 | 15,912 |
| 2013 | 16,818 | 15,075 | 15,966 | 15,841 | 17,521 | 18,028 | 17,562 | 16,745 | 16,346 | 16,533 | 16,448 | 16,673 |
| 2014 | 15,738 | 15,182 | 16,609 | 16,963 | 16,739 | 17,576 | 17,149 | 17,691 | 16,356 | 15,684 | 17,139 | 17,202 |
| 2015 | 15,449 | 15,716 | 17,762 | 16,798 | 17,097 | 16,742 | 17,538 | 17,323 | 16,285 | 15,338 | 15,726 | 17,243 |
| 2016 | 18,607 | 17,157 | 16,315 | 17,837 | 18,603 | 17,701 | 16,324 | 16,700 | 16,583 | 16,089 | 15,953 | 15,922 |
| 2017 | 15,985 | 15,804 | 17,028 | 16,377 | 16,795 | 17,368 | 18,141 | 17,296 | 17,241 | 17,221 | 18,012 | 16,773 |
| 2018 | 16,379 | 17,044 | 15,913 | 17,165 | 16,868 | 17,063 | 16,873 | 17,925 | 17,009 | 16,567 | 17,346 | 17,730 |
| 2019 | 16,618 | 17,023 | 17,342 | 19,219 | 19,314 | 18,577 | 18,821 | 17,648 | 18,008 | 16,116 | 17,019 | 19,271 |
| 2020 | 18,949 | 17,374 | 16,082 | 18,136 | 18,956 | 17,506 | 18,229 | 19,202 | 15,341 | 15,463 | 15,022 | 16,465 |
| 2021 | 17,345 | 15,432 | 16,168 | 17,043 | 18,677 | 17,291 | 17,646 | 17,575 | 16,132 | 15,803 | 14,871 | 17,137 |
| 2022 | 17,588 | 17,782 | 18,255 | 17,849 | 17,868 | 17,079 | 18,095 | 18,773 | 17,210 | 16,395 | 17,528 | 17,436 |
| 2023 | 17,842 | 18,780 | 17,847 | 18,854 | 18,974 | 18,857 | 17,563 | 17,175 | 19,002 | 16,496 | 16,252 | 18,750 |
| 2024 | 17,869 | |||||||||||
| - = No Data Reported; -- = Not Applicable; NA = Not Available; W = Withheld to avoid disclosure of individual company data. |
| Release Date: 3/29/2024 |
| Next Release Date: 4/30/2024 |